
FIGURE 3.
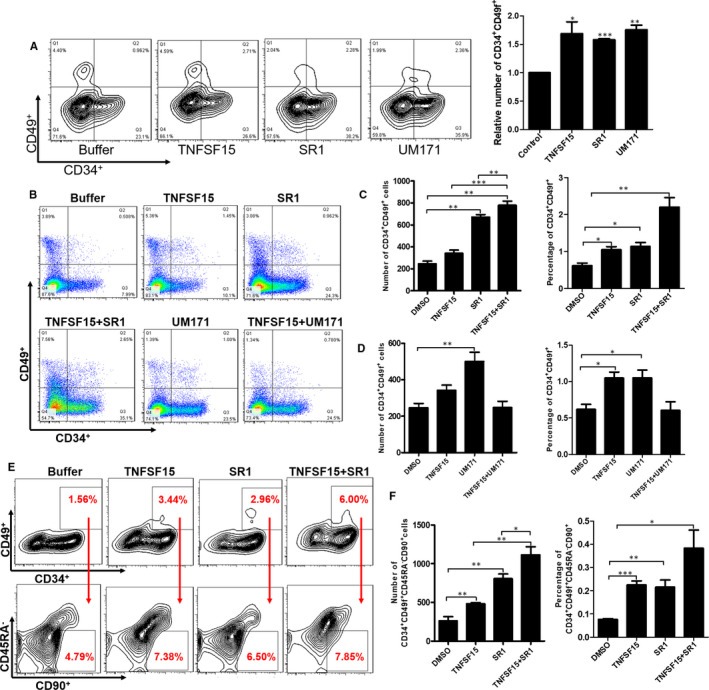
TNFSF15 showed synergistic effect in combination with SR1. A, Representative images of flow cytometry analysis of CD34+CD49f+ cells after the treatment of TNFSF15, UM171 and SR1 respectively for 7 d in expansion medium. TNFSF15 (2 µg/mL), SR1 (1 µmol/L) and UM171 (35 nmol/L). B, Representative images of flow cytometry after cultured with combination of TNFSF15 and SR1 or UM171. C, The percentage and absolute number of CD34+CD49f+ cells after cultured with combination of TNFSF15 (2 µg/mL) and SR1 (1 µmol/L); horizontal bar, mean value, n = 4. D, The percentage and absolute number of CD34+CD49f+ cells after cultured with combination of TNFSF15 (2 µg/mL) and UM171 (35 nmol/L); horizontal bar, mean value, n = 4. E, The representative images of flow cytometry after cultured with combination of TNFSF15 and SR1 for 7 d. F, The percentage and absolute number of CD34+CD49f+CD45RA−CD90+ cells after cultured with combination of TNFSF15 (2 µg/mL) and SR1 (1 µmol/L) for 7 d in expansion medium; horizontal bar, mean value, n = 3