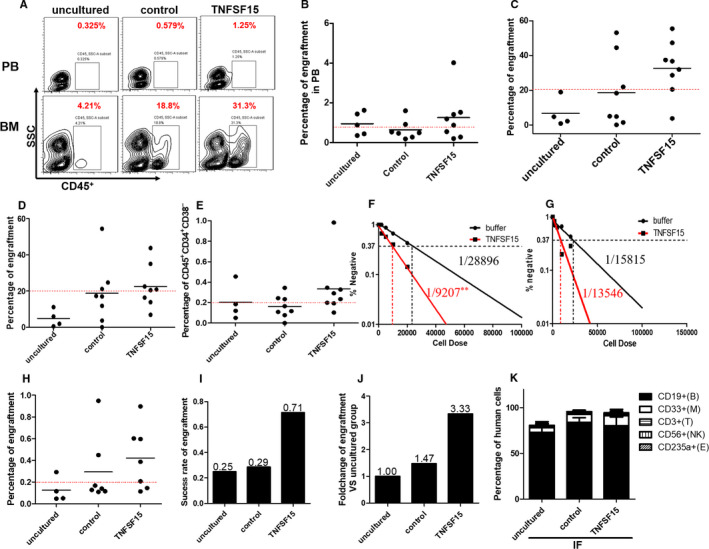
FIGURE 4.

TNFSF15‐induced enhancement of haematopoietic stem cell engraftment in NOD/SCID or NOG mice. A, Representative plots of flow cytometry analysis of human CD45+ engraftment in periphery blood and bone marrow of NOG mice engrafted with human UCB‐HSC. B, Percentages of engrafting human cells (CD45+) in periphery blood of the experimental animals 12 wk after the implantations; horizontal bars indicate mean values (n = 5 for uncultured group, n = 7 for control group and n = 8 for TNFSF15 group). C, Percentages of engrafting human cells (CD45+) in the bone marrows of the experimental animals 12 wk after the implantations; horizontal bars indicate mean values (n = 4 for uncultured group, n = 8 for control group and n = 8 for TNFSF15 group). D, Percentages of engrafting human cells (CD45+) in the untreated tibiae of the experimental animals 12 wk after the implantations; horizontal bars indicate mean values (n = 4 for uncultured group, n = 8 for control group and n = 8 for TNFSF15 group). E, Percentages of CD45+CD34+CD38− cells in the bone marrows of the experimental animals 12 wk after the implantations; horizontal bars indicate mean values (n = 4 for uncultured group, n = 8 for control group and n = 8 for TNFSF15 group). F, Frequencies of SCID mice repopulation cell measured by limiting dilution assay in NOD/SCID mice in the presence or absence of TNFSF15 (2 µg/mL) for 7 d in expansion medium. Four cell concentrations were set in each group (initiating CD34+ cells: 2 × 10⁴ cells [n = 7], 1 × 10⁴ cells [n = 7], 5000 cells [n = 7] and 2000 cells [n = 10]). The frequency of SRC cells was calculated by L‐Calc software for limiting dilution assay. G, Frequencies of SCID mice repopulation cell measured by limiting dilution assay in the untreated tibiae of NOD/SCID mice. H, Percentages of engrafting human cells (CD45+) in bone marrow 16 wk after the secondary implantation in NOG mice in the presence or absence of TNFSF15 (2 µg/mL) for 4 d (for uncultured, n = 4 mice per group; for control, n = 7 mice per group; for TNFSF15, n = 7 mice per group); horizontal bars indicate mean values. I, Success rates of engraftment in secondary implantations in bone marrow 16 wk after the implantation in NOG mice. J, Fold changes of engraftment of TNFSF15‐treated in comparison with uncultured or vehicle‐treated cells in bone marrow 16 wk after secondary implantations in NOG mice. K, Percentage of cells in multi‐lineage differentiation in multi‐lineage differentiation including myeloid (CD33+), lymphocyte cell (CD19+), T lymphoid cell (CD3+), erythroid cell (CD235a) and NK cell (CD56) after transplantation
