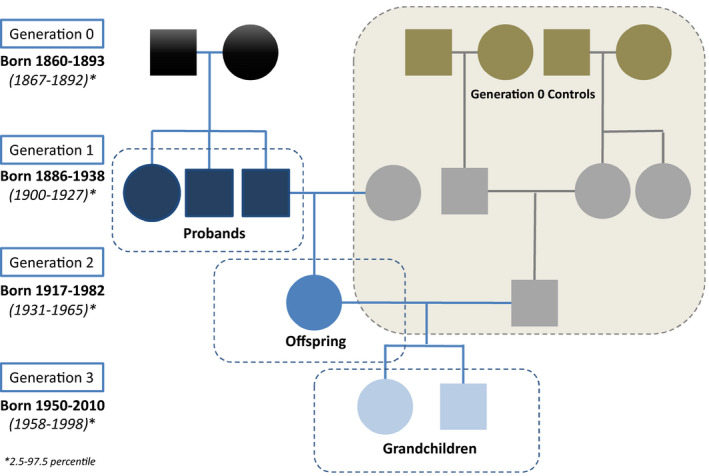
FIGURE 2.

Pedigree structure for the longevity‐enriched families and control families. The blue figures in Generation 1 are the long‐lived siblings who are the probands in the study. For simplicity, only one of the offspring of the probands are shown in the pedigree. The green/gray figures are married‐in control families in the 1916 Census analyses of the socioeconomic conditions for Generation 0 in the longevity‐enriched families. For each of the offspring and grandchildren, 10 age‐ and sex‐matched controls were randomly selected from a 5% random sample of the Danish population through register linkage (not shown in the figure)
