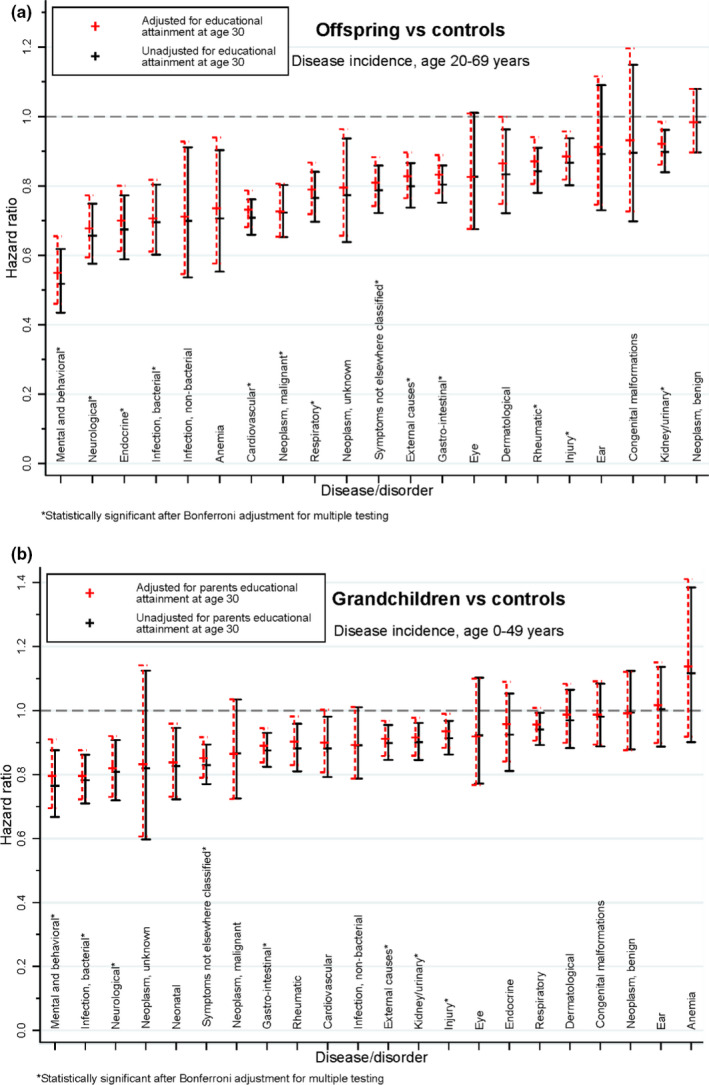
FIGURE 3.

(a) Offspring of Danish longevity‐enriched families vs. age‐ and sex‐matched controls from a random sample of the general Danish population: comparison of incidence of disease‐specific hospitalization for 22 major disease categories. Bars indicate 95% CI. (b) Grandchildren of Danish longevity‐enriched families vs. age‐ and sex‐matched controls from a random sample of the general Danish population: comparison of incidence of disease‐specific hospitalization for 22 major disease categories. Bars indicate 95% CI.
