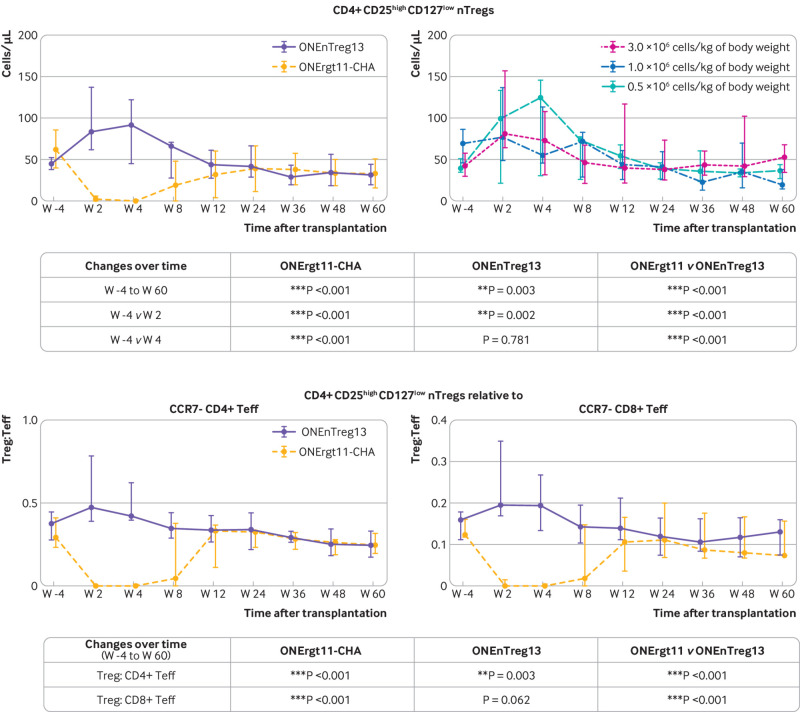
Fig 5.
Exploratory biomarker analysis of therapy response to nTreg treatment. More than 100 biomarkers were analysed in patients receiving nTregs, with a more comprehensive summary presented in figures S5-S6. Patients receiving nTregs were evaluated according to cell dose applied and compared with reference group. Transiently enhanced Treg levels and favourable Treg:Teff ratio. Upper panels: multiparameter flow cytometry profiling of nTregs in patient blood either comparing nTreg with reference group or showing the infused cell dose (0.5, 1.0, and 2.5-3.0×10⁶ cells/kg of body weight); table shows significance levels. Lower panels: ratio between CD4+ CD25high CD127low Treg levels relative to either CCR7– CD4+ or CCR7– CD8+Teffs shown as representative result for almost 60 immune cell subsets shown in figure S6; table shows significance levels. nTreg=natural regulatory T cell; Teff= effector T cell; Treg=regulatory T cell

