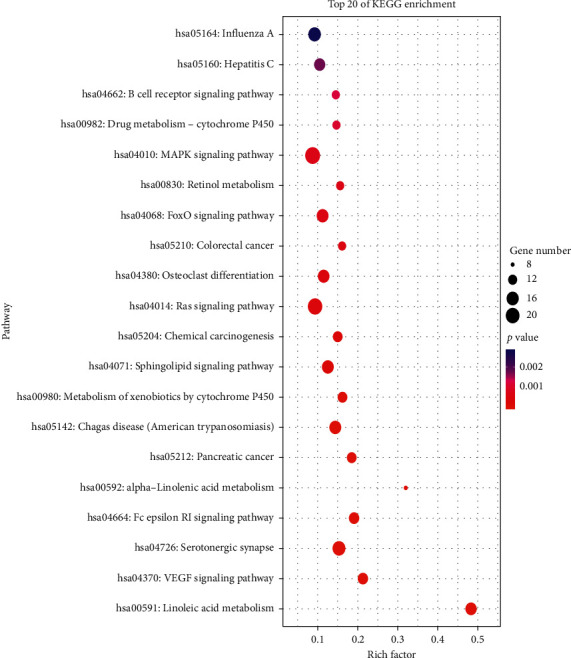
Figure 5.

Bubble chart of top 20 signaling pathways linked to SXZKF against pharyngitis. Bubble size represented the number of genes enriched in this pathway, color depth represented the P value, and rich factor represented the ratio of the enriched targets in the pathway to the total number of targets in the pathway.
