Figure 6.

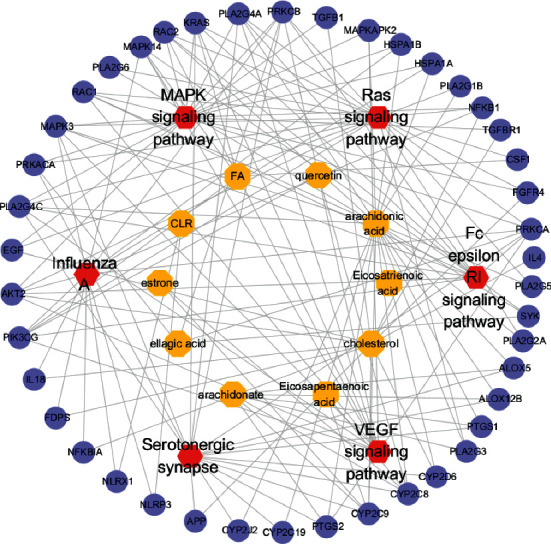
C-T-P network. Yellow nodes represent the bioactive compounds, red nodes represent the key pathways, and purple nodes represent the target genes.

C-T-P network. Yellow nodes represent the bioactive compounds, red nodes represent the key pathways, and purple nodes represent the target genes.