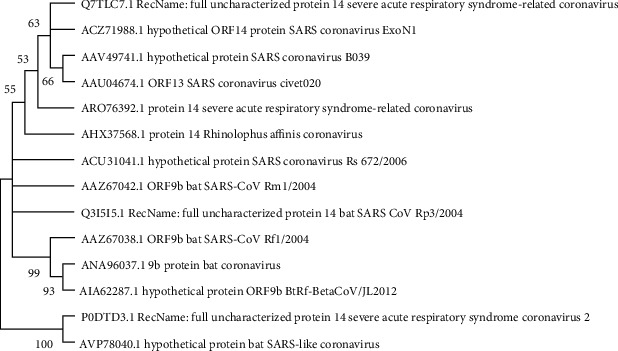
Figure 11.

Evolutionary analysis of ORF14 protein of SARS-CoV-2 by Maximum Likelihood method and JTT matrix-based model (Jones and Taylor, 1992). The tree with the highest log likelihood (-497.56) is shown. The percentage of trees, in which the associated taxa clustered together, is shown next to the branches. This analysis involved 14 amino acid sequences. There were a total of 73 positions in the final dataset. Evolutionary analyses were conducted in MEGA X.
