
Figure 1. Vaccine Attributes and Vaccination Preferences.
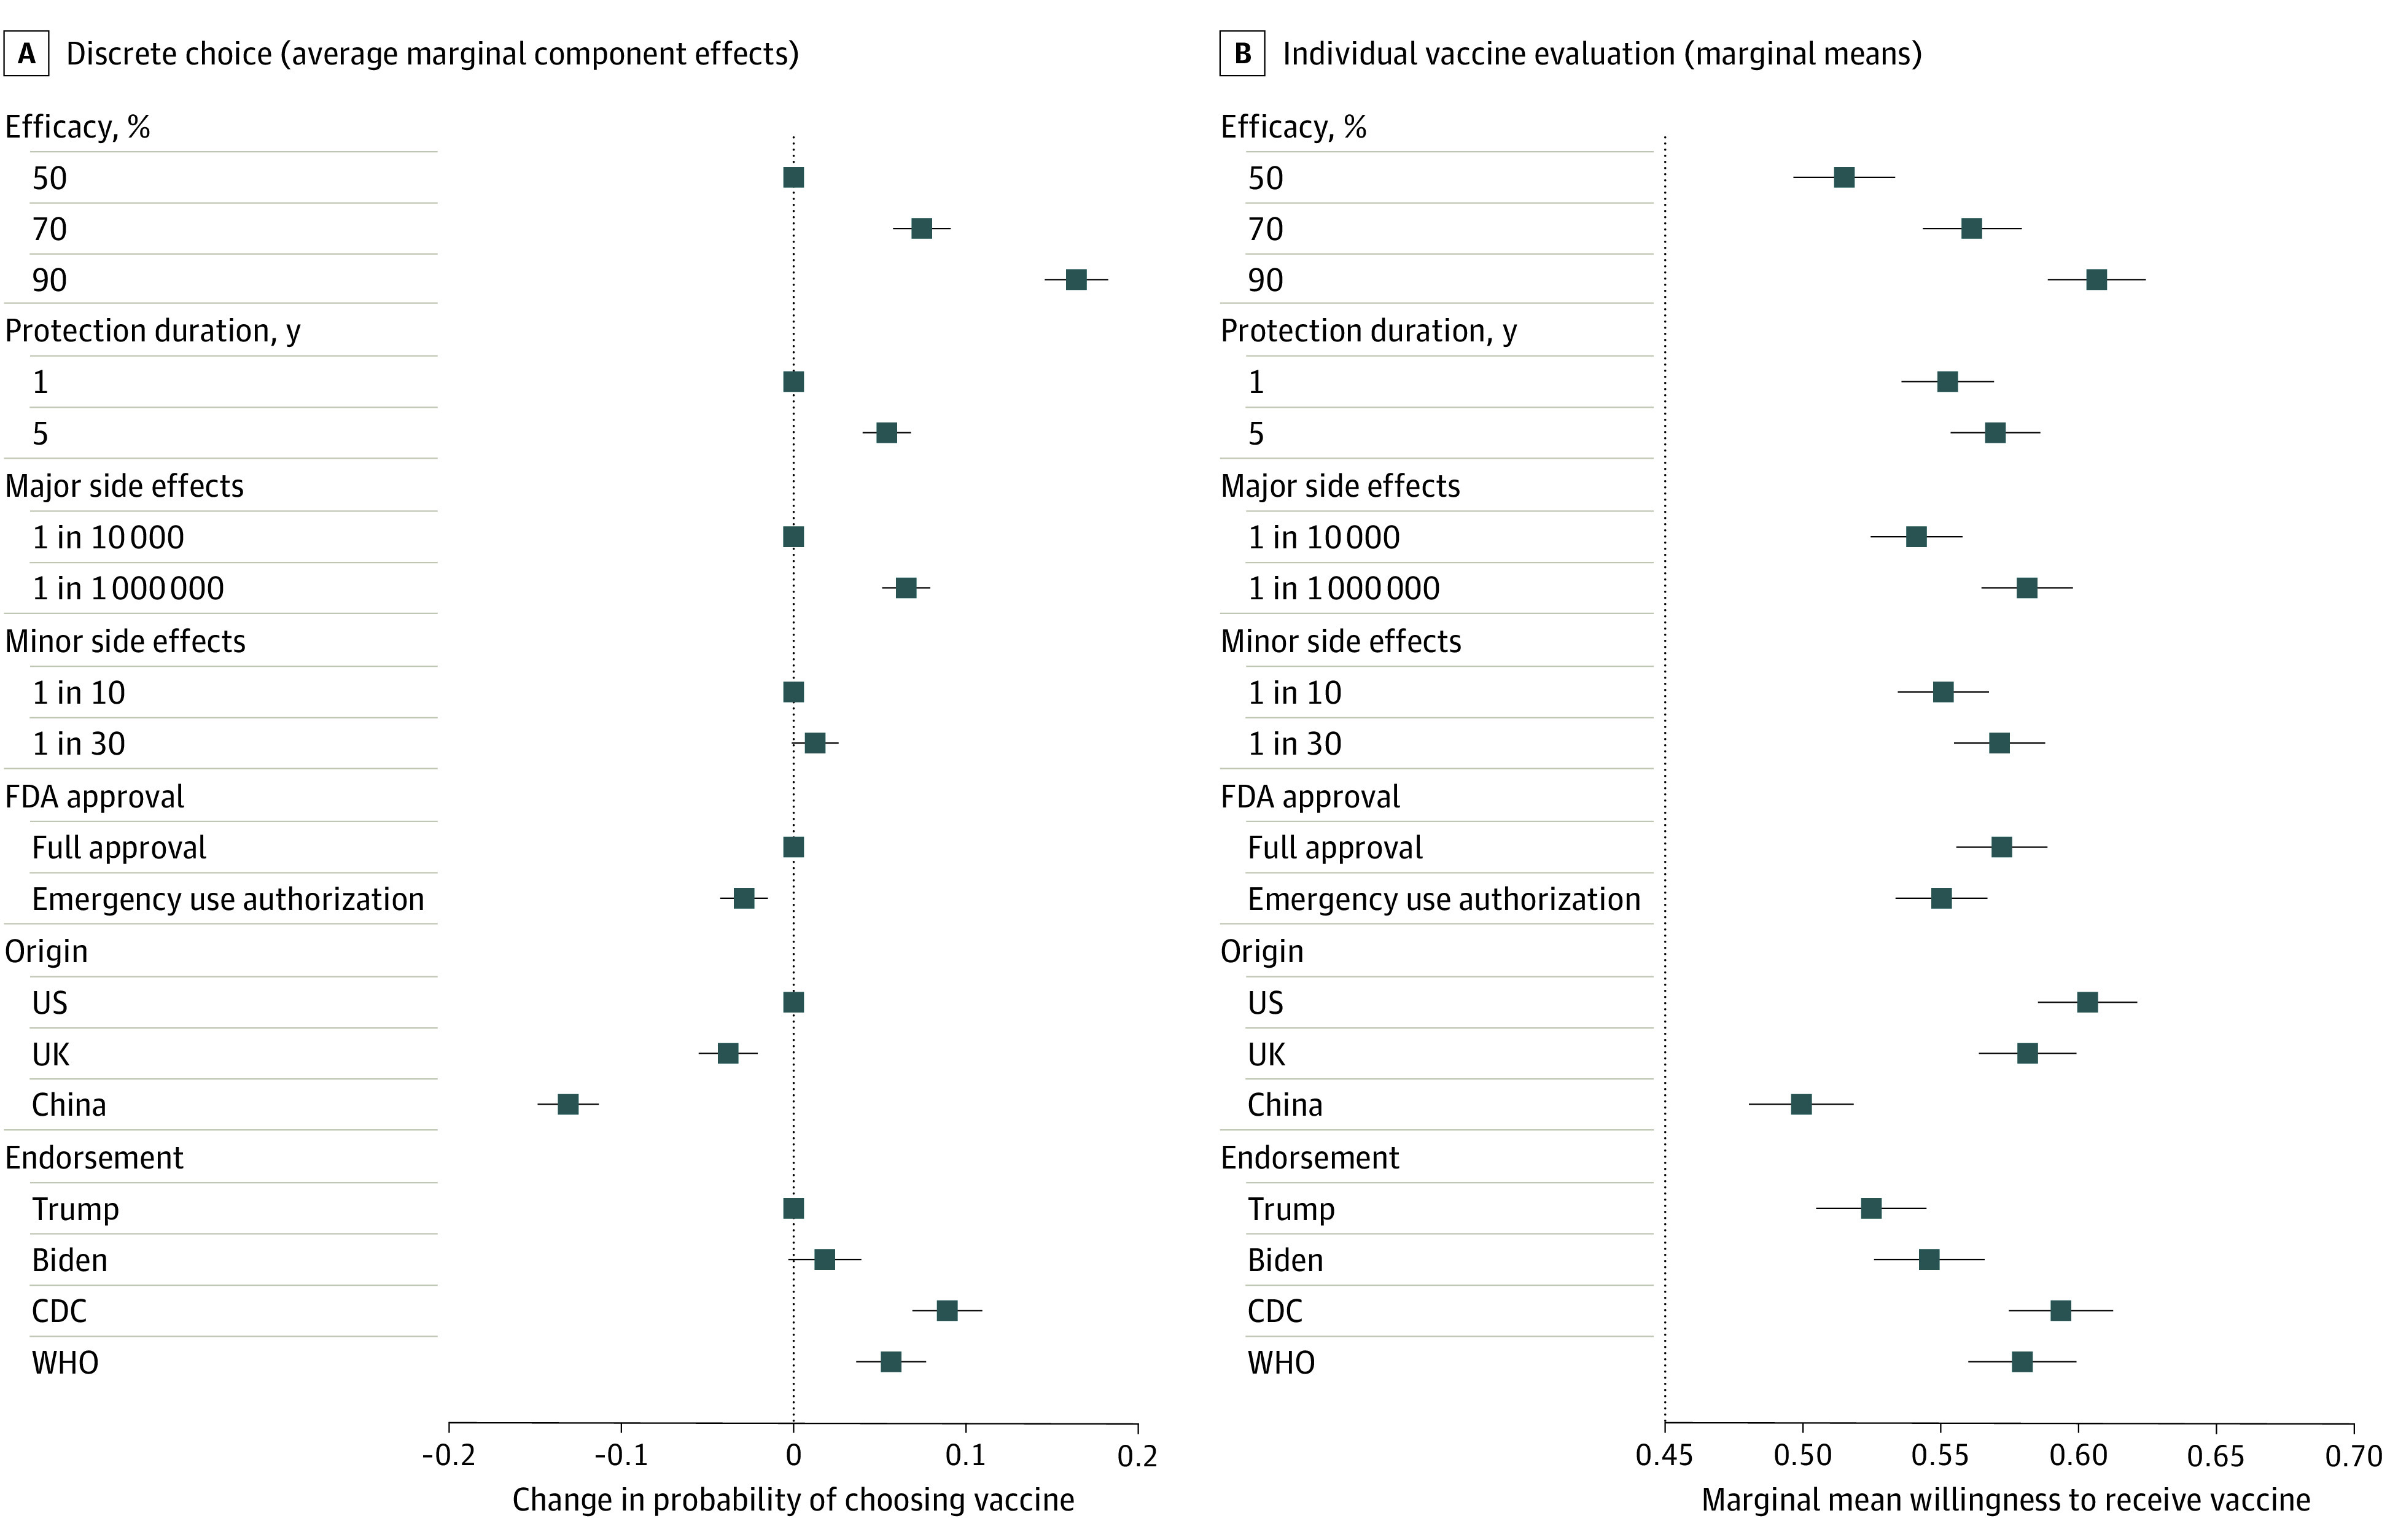
Panel A shows the estimated effect size of each attribute value on the probability of a study respondent choosing a hypothetical coronavirus disease 2019 (COVID-19) vaccine. The average marginal component effect sizes plotted here are the regression coefficients reported in Model 1 in Table 3. The points without error bars denote the base level value for each attribute. Panel B shows the marginal means for each attribute value for willingness to receive a hypothetical COVID-19 vaccine. Estimates are based on Model 3 in Table 3, and numerical point estimates and confidence intervals are reported in eTable 2 in the Supplement. In both panels, error bars represent 95% CIs around each point estimate. CDC indicates Centers for Disease Control and Prevention; FDA, US Food and Drug Administration; and WHO, World Health Organization.