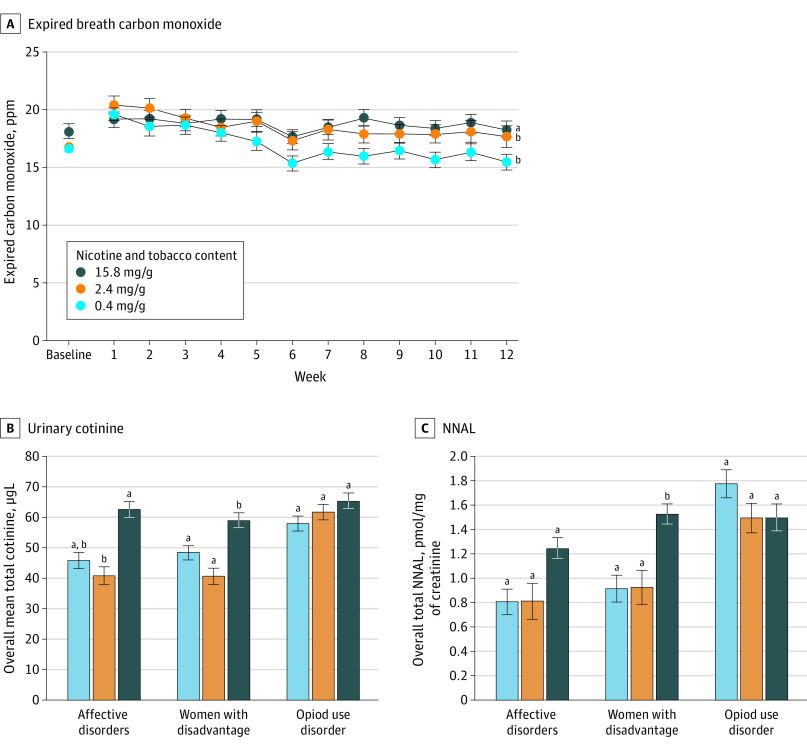
Figure 4. Biomarkers of Exposure as a Function of Dose, Time, and Population.
A, Data points are arithmetic means across participants and populations and error bars indicate SEM. Doses not sharing a superscript letter differ in linear trends across the 12-week study period. B, Data points are geometric means across participants and time at each dose; error bars represent SEM. Data points not sharing a superscript letter differed significantly in post-hoc testing. C, Data points are geometric means across participants and time at each dose; error bars indicate SEM. Data points not sharing a superscript letter differed significantly in post hoc testing.

