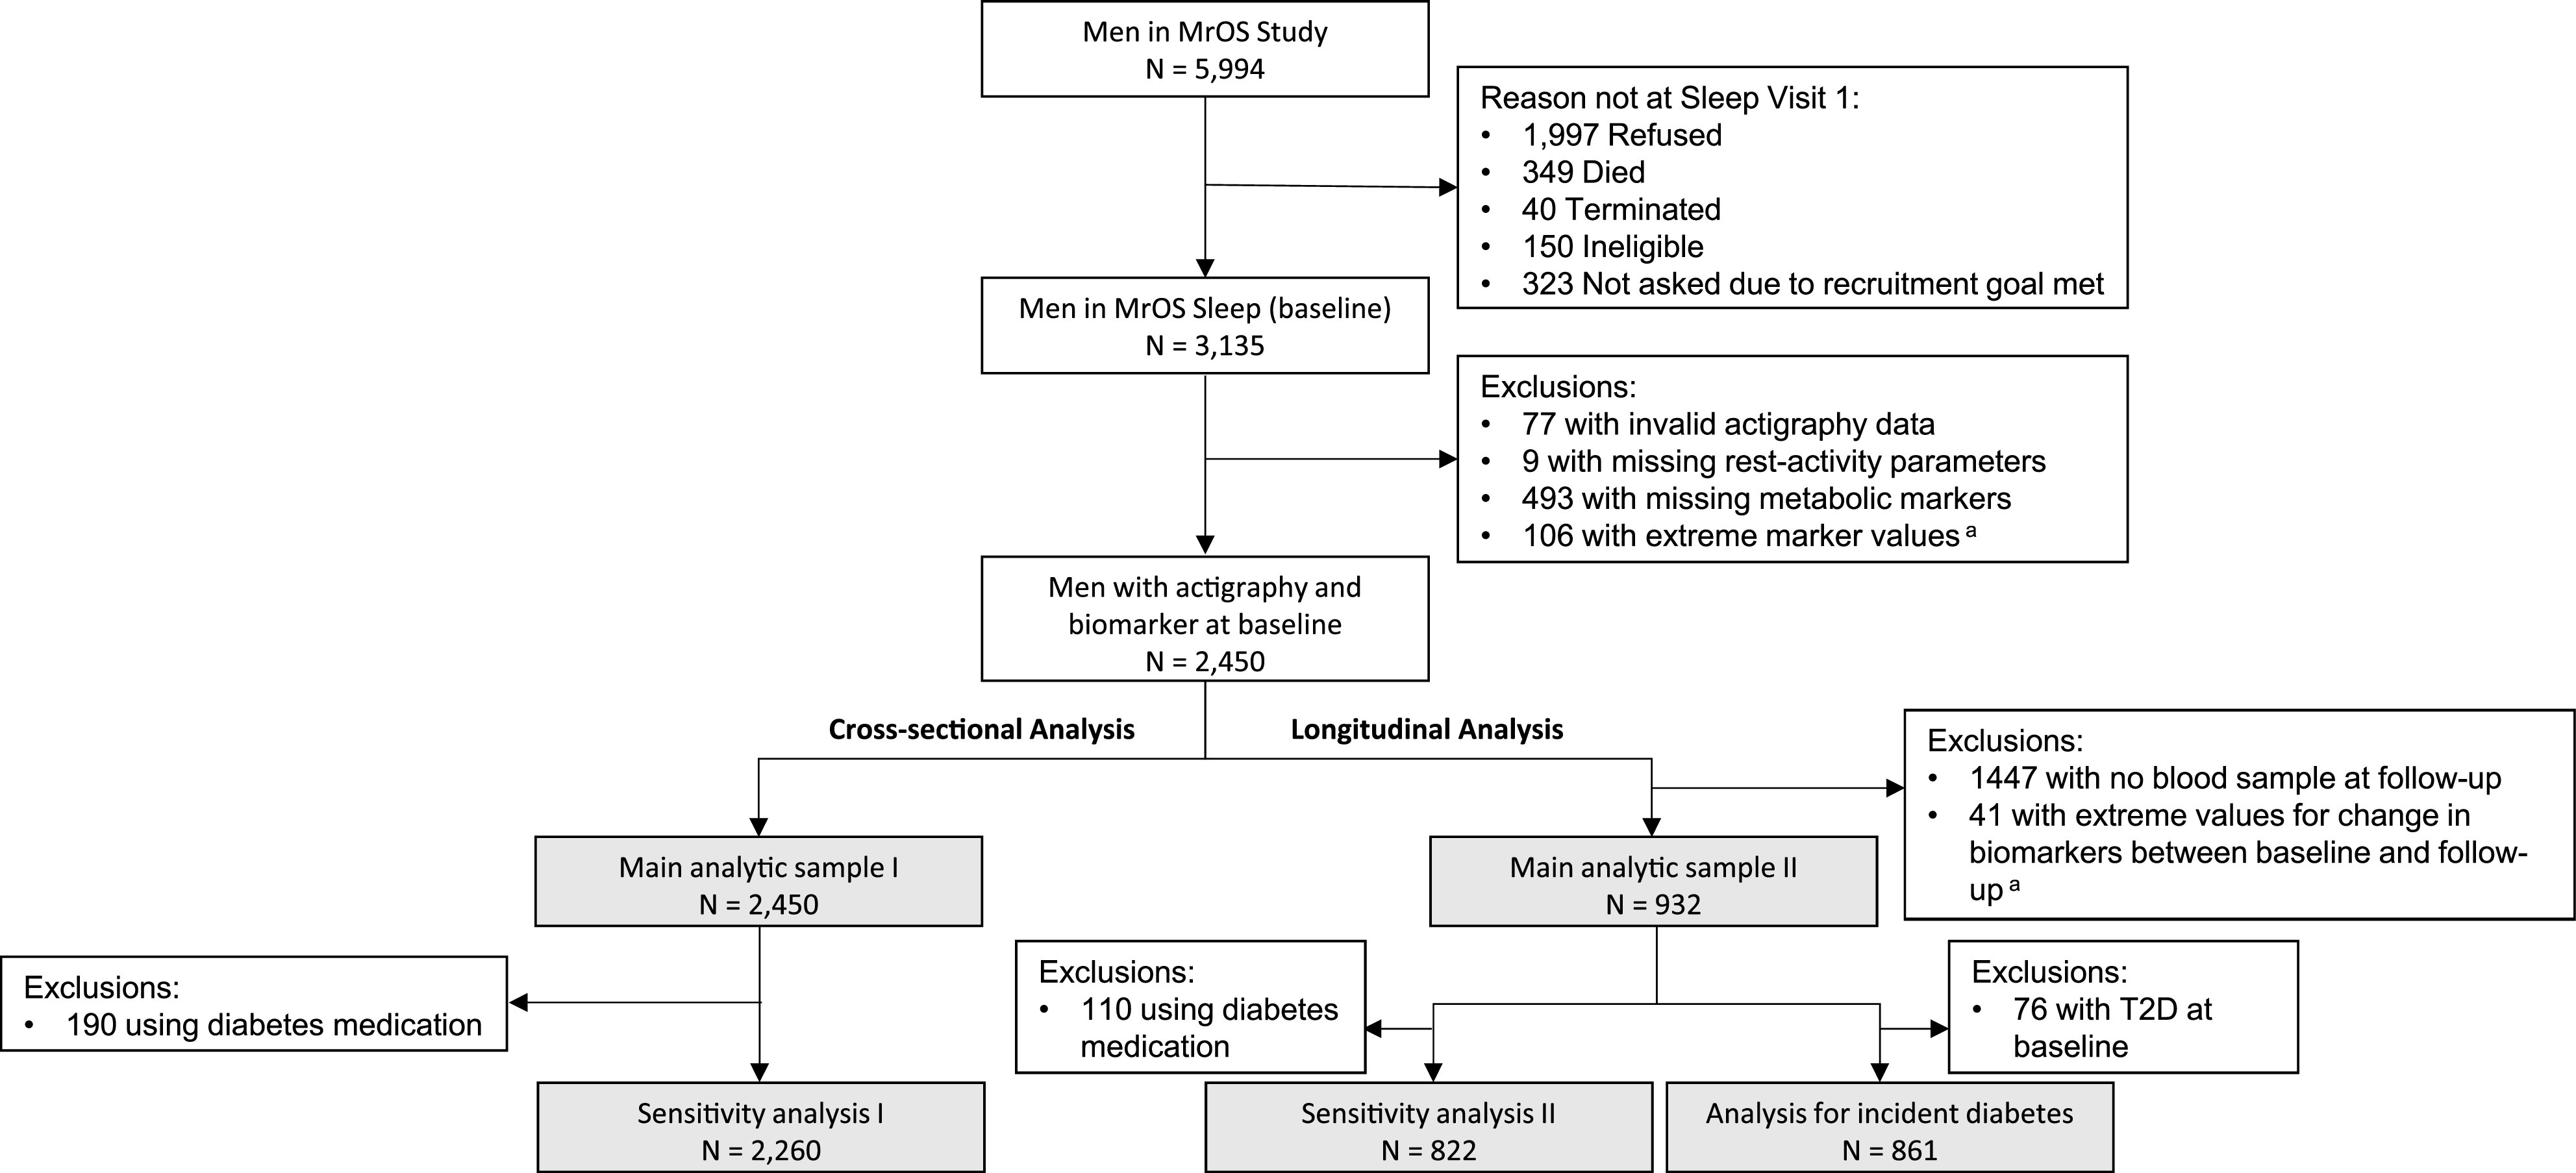
Figure 1.

Flowchart showing the progression of participants. Gray-shaded rectangles show numbers for analytic samples for various analyses. aExtreme values were defined as <1% or >99% of the sample distribution. T2D, type 2 diabetes.

Flowchart showing the progression of participants. Gray-shaded rectangles show numbers for analytic samples for various analyses. aExtreme values were defined as <1% or >99% of the sample distribution. T2D, type 2 diabetes.