
Figure 2.
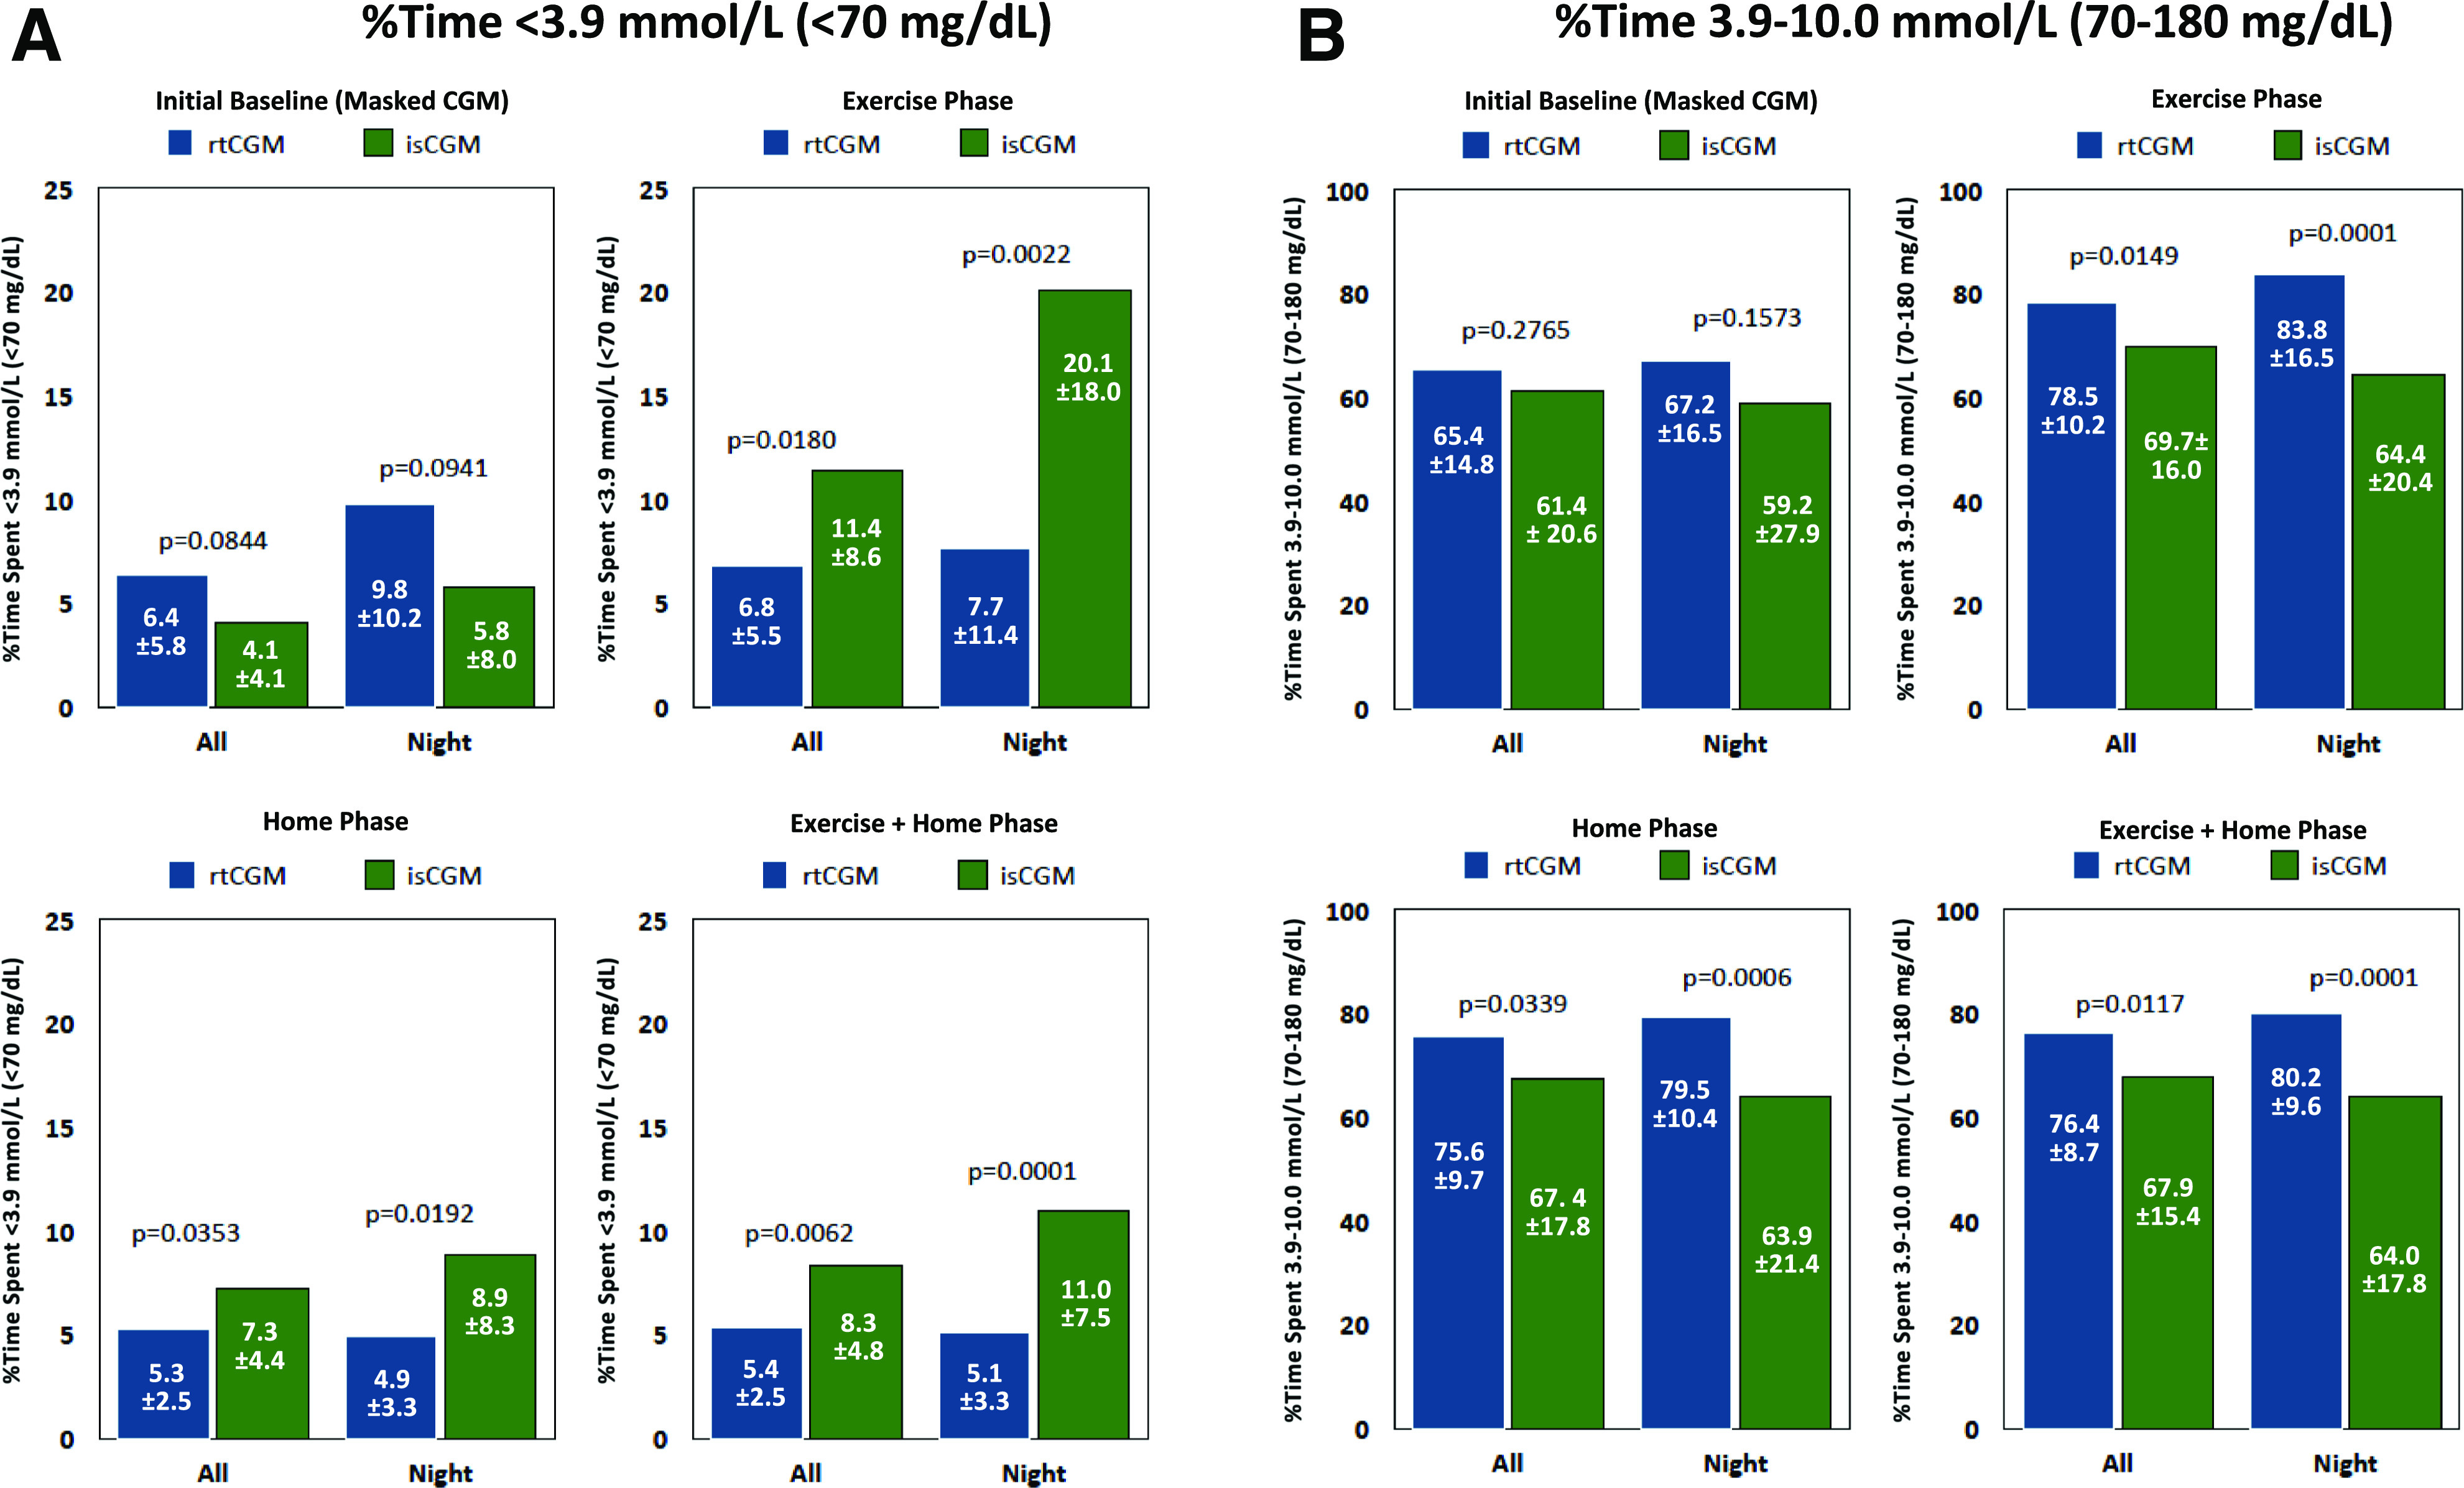
Percentage of time below (A) and within (B) target range. A: Graphs present percentage of TBR within the full 24-h and nighttime (0000–0559 h) periods during baseline (masked CGM), exercise, home, and exercise plus home phases. B: Graphs present percentage of TIR during the same time periods and study phases.