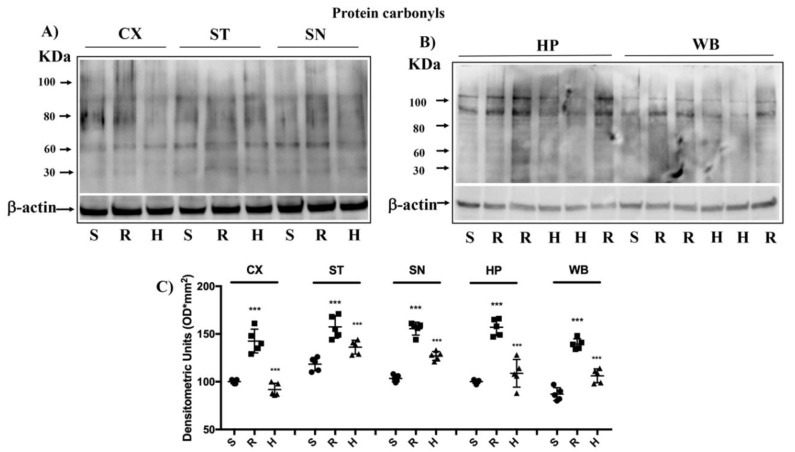
Figure 7.
Brain protein carbonyls analysis after rotenone intoxication. (A,B) The examination of the carbonyls of brain proteins showed a significant increase of these in all brain regions examined after induction of rotenone (R), compared to the control (S) and animals treated with HD (H). The data are expressed as mean ± SEM from N = 5 mice/group. (C) *** p < 0.001 vs. Sham; *** p < 0.001 vs. rotenone.

