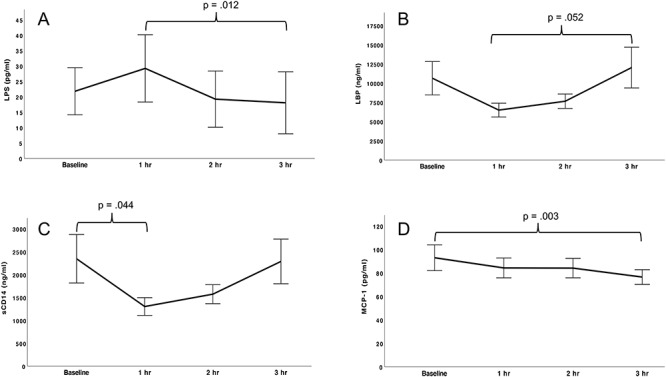
Fig. 2.

Change in biomarkers following a moderate dose of alcohol; LPS, LBP, sCD14 and MCP-1 changed significantly during the 3-hour period following alcohol administration; all participants (N = 11) were included in LPS and MCP-1 analyses, and 10 participants were included in sCD14 and LBP analyses; brackets indicate time points that differed significantly (P < 0.05) or at the trend level (P = 0.05), (A) LPS showed a significant linear decrease (P = 0.029); on pairwise tests, LPS was significantly lower at Hour 3 relative to Hour 1 (P = 0.012), (B) LBP showed a significant negative linear effect (P = 0.010) and positive quadratic effect (P = 0.003), consistent with a U-shaped curve; pairwise tests indicated that LBP showed a trend toward a higher concentration at Hour 3 compared to Hour 1 (P = 0.05), (C) sCD14 showed a significant negative linear effect (P = 0.019) and positive quadratic effect (P = 0.012), consistent with a U-shaped curve; on pairwise tests, sCD14 decreased significantly from baseline to Hour 1 (P = 0.044), (D) MCP-1 showed a significant linear decrease (P = 0.007), MCP-1 at Hour 3 was significantly lower than at baseline (P = 0.003).
