Figure 3.
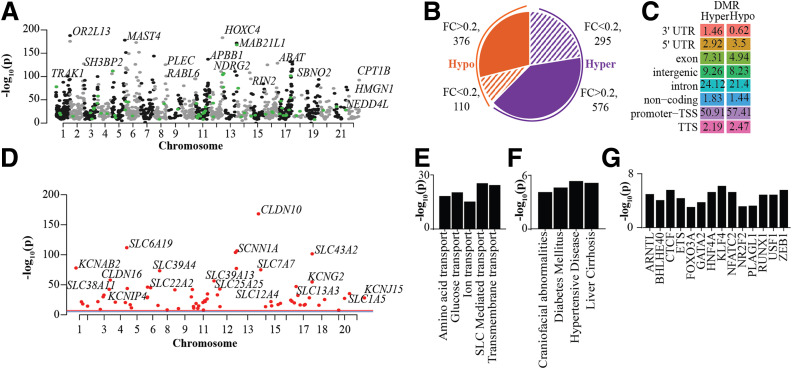
DNAme profiles of PTECs showing differential patterns in N- and T2D-PTECs. A: Manhattan plot of DMRs in T2D-PTECs compared with N-PTECs. Top DMR-associated genes are highlighted. Each dot depicts a DMR; black and gray dots are for DMRs in even and odd chromosomes, and green dots highlight DMRs associated with TAGs. B: Pie chart showing number of DMRs on the basis of fold change (FC) (T2D vs. N) and that have an adjusted P < 0.05. Orange indicates hypomethylated DMRs and purple, hypermethylated DMRs. Shaded areas show DMRs with <20% FC, whereas solid colors represent DMRs with >20% FC. C: Percent genomic distribution of hyper- and hypomethylated DMRs. D: Manhattan plot highlighting candidate TAGs with a DMR within 20 kb of their TSS. E–G: Enriched GO pathways (E), disease ontology terms (F), and TF motifs (G) for genes within 50 kb of DMRs. Bar = −log10(p). TTS, transcription termination site.

