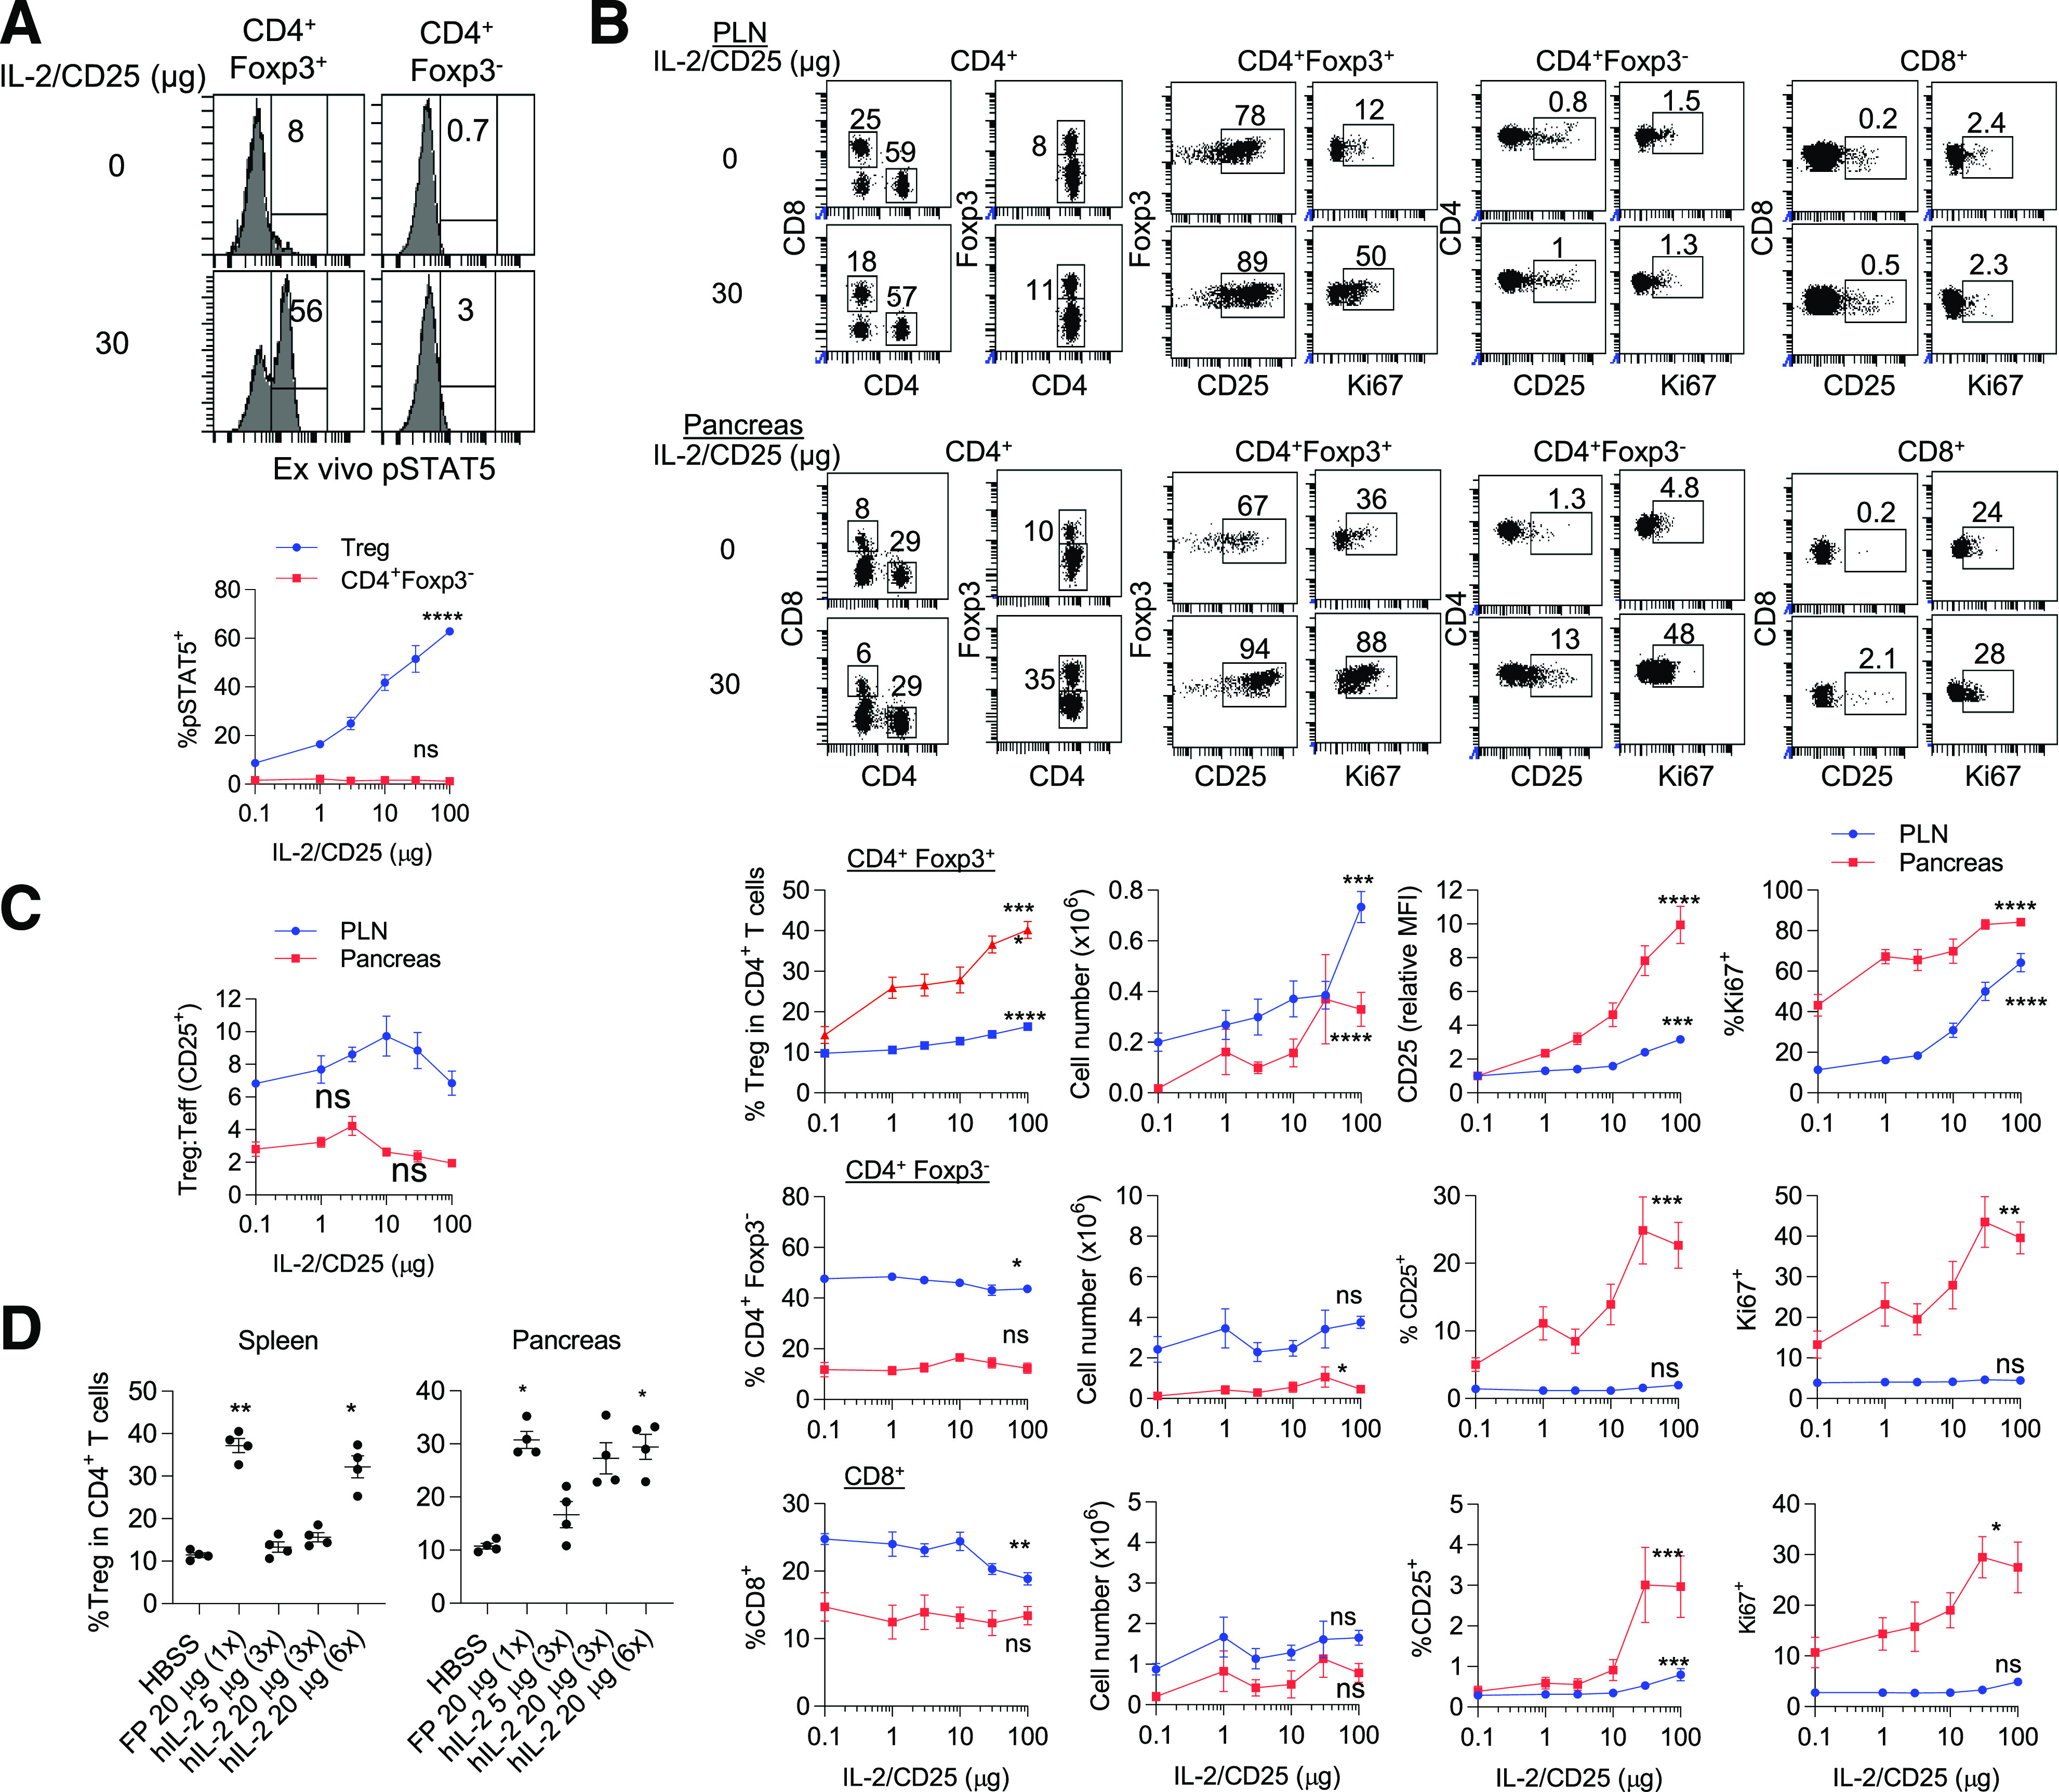
Figure 1.

Low-dose mIL-2/CD25 selectively increases Tregs in NOD mice. Six- to 7-week-old female NOD mice received a single dose of mIL-2/CD25 or HBSS, and the indicated cell populations from spleen, PLN, and pancreas were assessed 72 h posttreatment. A: Representative FACS histograms (top) and quantitative data (bottom) for pSTAT5 amounts in splenic Tregs assessed directly ex vivo (n = 5–6/group). B: Representative FACS dot plots (top) and quantitative data (bottom) of the proportions, numbers of CD4+Foxp3+ Treg, CD4+Foxp3− Tconv, and CD8+ T cells, and their expression of CD25 and Ki67 in the PLN and pancreas (n = 7–10/group). C: The ratio of CD4+Foxp3+ Tregs to CD4+CD25+ Teff cells was enumerated for the PLN and pancreas after gating on each cell population (n = 4/group) as represented in Supplementary Fig. 1. D: The expansion of Tregs 3 days after administering a single injection of mIL-2/CD25 or daily (3 times) or every 12 h (6 times) injections of IL-2, as indicated (n = 4/group). B–D: Data are shown as mean ± SEM and were analyzed by unpaired one-way ANOVA Kruskal-Wallis test. Significance of the dose response (B) or the comparison of mIL-2/CD25 vs. IL-2 (D) was assessed relative to control HBSS-treated mice. *P ≤ 0.05; **P ≤ 0.01; ***P ≤ 0.001; ****P ≤ 0.0001. FP, fusion protein; MFI, mean fluorescence intensity.
