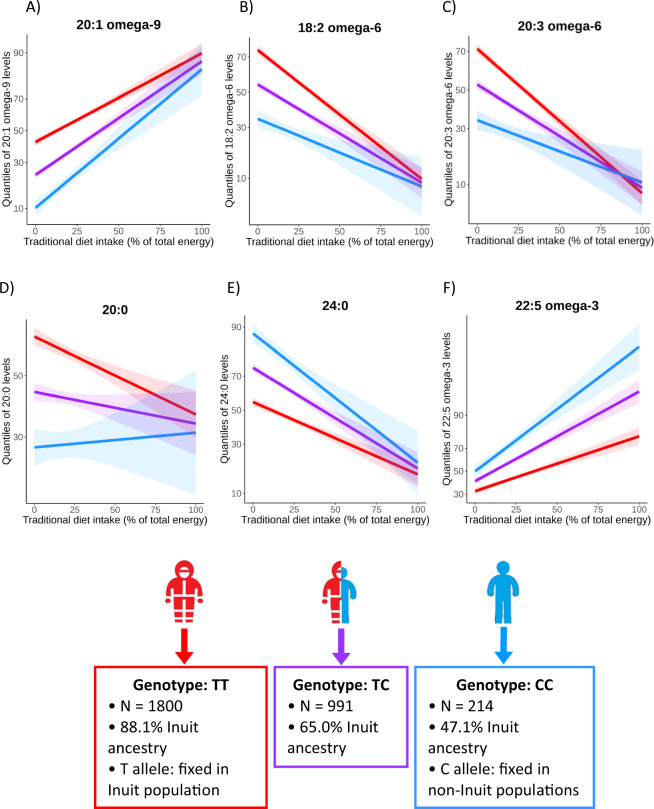
Fig. 1. Plots of the significant (p < 0.00417, C and F) and nominal significant (p < 0.05, A, B, D, and E) interaction effects from standard interaction model adjusted for age, sex, cell type measured (erythrocytes or all blood cells), SNP effect, and diet as fixed effects and including the genetic similarity matrix as random effect.
The plots are made in R using a model adjusted for age, sex, cell type measured (erythrocytes or all blood cells), SNP effect, diet, and principal component 1–5. Inuit global ancestry proportions among the different genotypes given are medians (Table 1). The derived and ancestral allele is fixed in Inuit and non-Inuit populations respectively (7). Red: homozygous for derived allele. Purple: heterozygous. Blue: homozygous for ancestral allele. T derived allele, C ancestral allele.

