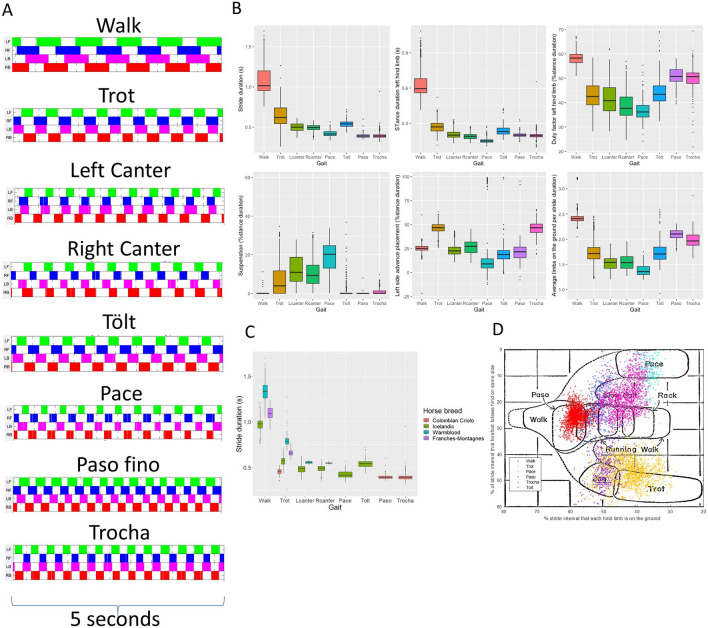
Figure 1.
Descriptive results for stride parameters for all gaits. (A) Footfall pattern of each different gait. White: swing phase; color: stance phase. LF Left front, RF Right front, LB Left hind, RB Right hind. (B) Different stride parameters, calculated from the limb-mounted IMUs, grouped by gait. (C) Stride duration clustered by gait and horse breed. Note the specific breed characteristics (i.e., clustering). (D) Our data overlapping the original Hildebrand 1965 plot where x axis: diagonal advanced placement, y axis: lateral advanced placement.

