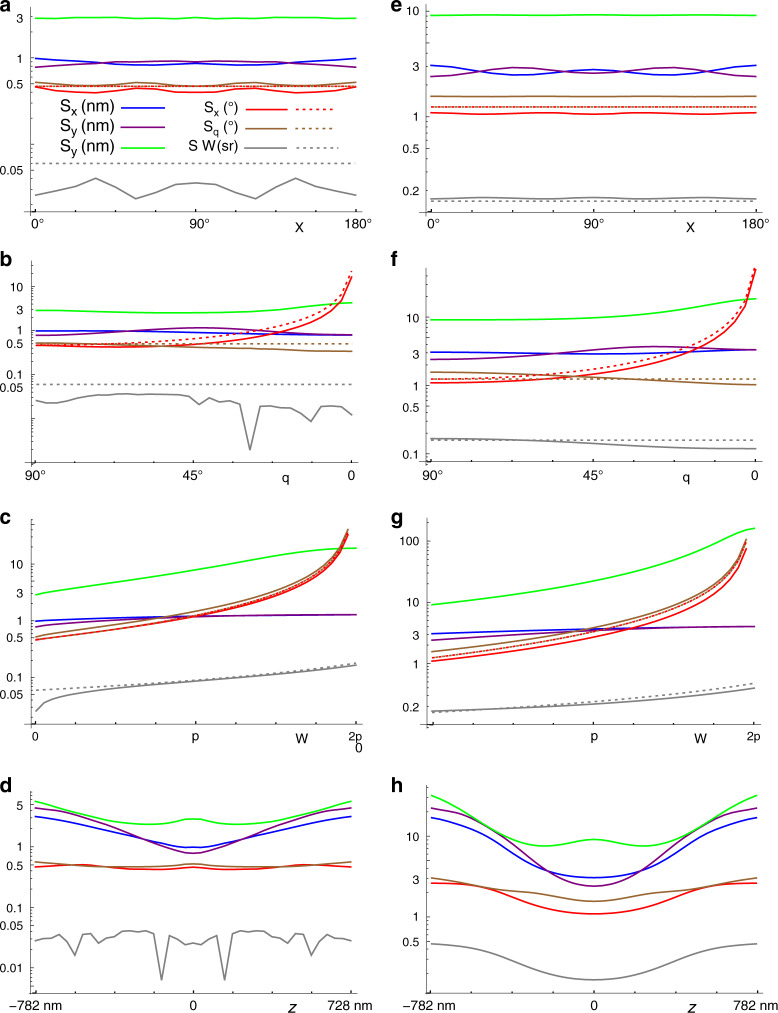
Fig. 4. Cramer–Rao lower bounds for the six measured parameters.
These plots assume 10,000 signal photons over both channels, for a–d no background photons, and e–h a SBR of 1/3, corresponding to a background of about 250 photons per pixel. The parameters are a, e x = y = z = 0, θ = 90°, Ω = 0, and varying ξ; b, f x = y = z = 0, ξ = 0°, Ω = 0, and varying θ; c, g x = y = z = 0, ξ = 0°, θ = 90°, and varying Ω; d, g x = y = 0, ξ = 0°, θ = 90°, Ω = 0, and varying z. The units for each curve are indicated in the legend in (a). The dashed lines indicate the simple estimates in Eq. (6c).

