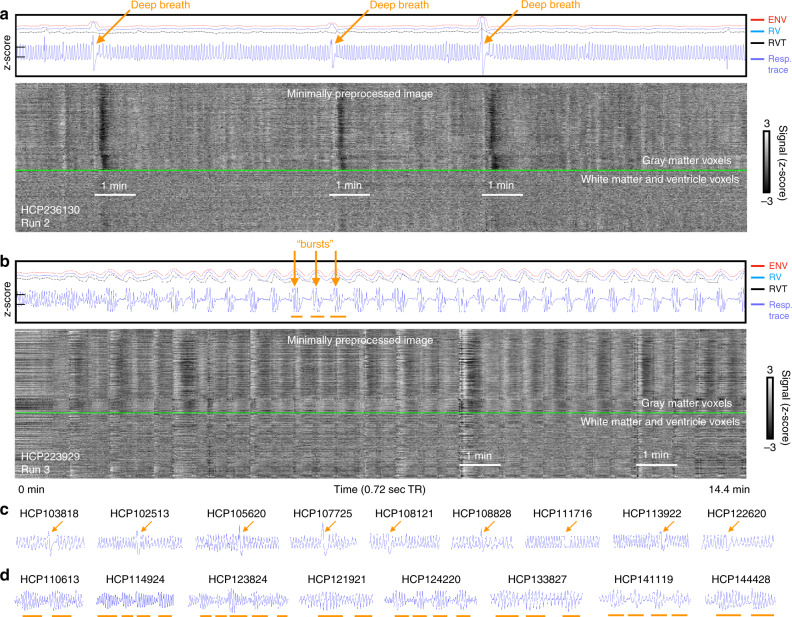
Fig. 1. Gray plots of scans containing deep breaths and bursts.
Gray plots containing a deep breaths and b bursts. Upper panels show the z-scored respiratory belt traces in blue (y-ticks at left are z = −1 and 1), and 3 commonly derived respiratory measures (ENV, RV, and RVT, with vertical offsets to enable non-overlapping visualization; scales are identical in all figures). In the grayscale heat maps, all in-brain fMRI signals are shown organized by anatomical compartment, with a green line separating gray matter from white matter and ventricle signals. In a, three deep breaths are indicated by arrows, with major decreases (vertical black bands) in fMRI signal following each of the breaths. In b, over two dozen bursts are present (arrows mark several), with accompanying modulations of fMRI signals. Supplementary Figs. 1 and 2 show comprehensive versions of each scan. Additional exemplars of deep breaths (c) and bursts (d) are shown at the bottom. The code to produce gray plots was published in ref. 49, and comprehensive gray plots of all 17,640 scans are shown in Supplementary Movie 1.

