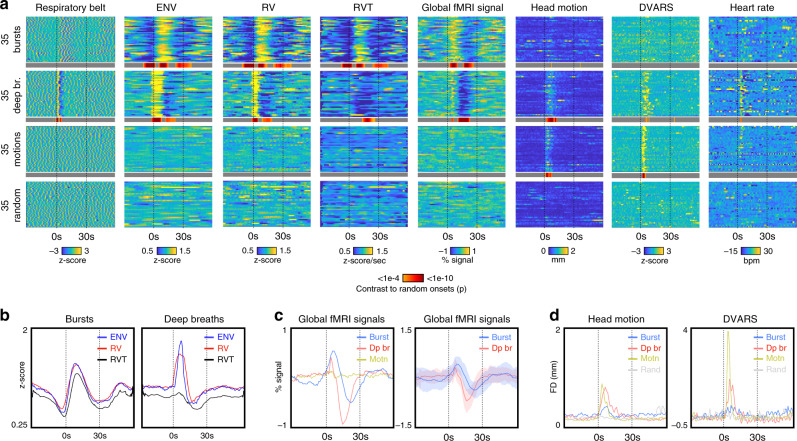
Fig. 3. Properties of deep breaths and bursts.
a Heat maps at the top illustrate 90-s segments surrounding visually identified events. In different subjects, 35 examples each of bursts, deep breaths, and isolated non-respiratory motions were identified from respiratory belt traces and motion traces. In the motion-exhibiting subjects, a random set of timepoints was also selected. Illustrated are respiratory belt traces, three respiratory measures (ENV, RV, and RVT), the global (gray matter average) fMRI signal, head motion (framewise displacement, following filtering, and 4-TR calculation as in ref. 16), and DVARS (z-scored). A gray/red heatmap represents statistically significant differences from the random events (two-sample t-test, two-tailed) beyond p < 0.001, illustrated on a logarithmic scale capped at p < 1e−10. The basis of bursts and deep breaths are apparent in the respiratory belt images. b Mean signals of ENV, RV, and RVT congruently mark bursts, but deep breaths display differences across the respiratory measures, with RVT having little positive deflection. c Mean global fMRI signals differ across patterns: deep breaths have brief signal increases and marked signal decreases with nadir near 15 s, and 30 s to resolution, on average. Bursts have more marked positive deflections, and slower timecourses on average, resolving near 40 s on average. Motion produces no global fMRI signal changes. Shade plots reflect mean and std. d Deep breaths display considerable motion and DVARS changes time-locked to event onsets; bursts have smaller time-locked modulations that do not achieve significance. Source data are provided as a source data file.

