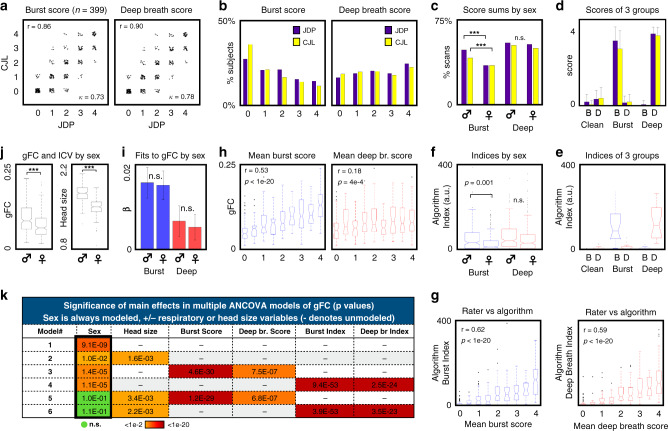
Fig. 4. Rater scorings and algorithmic indices detect sex effects and global functional connectivity influences.
a Plots of total scans (of 4) with bursts and deep breaths for both raters, with score correlations and Cohen’s kappas inset, for N = 399 subjects (all panels display results from N = 399 subjects except d and e, which concern the three 21-subject groups). b Histograms of scores across subjects for both patterns, showing raters by color. c Bar graph of percent scans of each sex displaying patterns. Chi-squared tests of bursts yield p = 3.4e−8 and 8.8e−7 for J.D.P. and C.J.L. (denoted by ***), effects unchanged by excluding members of the three groups. No significant differences are seen by sex in deep breath scores. d Bar plots showing mean values with std error bars of the ratings in a clean, burst, and deep breath groups (each with N = 21 unrelated subjects). B and D denote burst and deep breath. Desired respiratory properties are found in each group. e Algorithm indices of the three 21-subject groups, corroborating rater scores and confirming desired breathing patterns (compare with d directly above). Box plots show median and 25th and 75th percentiles as boxes, whiskers encompass 99% of normally distributed data, outliers are individually marked (all box plots in later panels follow this format). f Algorithm indices of breathing patterns by sex, with significant differences by two-sample t-test in bursts but not deep breaths (compare with c directly above). g Box plots of algorithm indices for each pattern as a function of mean rater score, demonstrating significant Pearson correlations of humans and algorithm ratings. h Box plots of gFC as a function of mean pattern scores, showing much stronger effects of bursts on gFC, quantified by Pearson correlation. i Betas of multiple linear regression of pattern scores in gFC (gFC = b0 + b1*burst_score + b2*deep_breath_score), performed in each sex separately, showing much stronger effects of bursts. Bars show mean values, error bars show 95% confidence intervals; fits do not differ by sex (both n.s. by two-sample two-sided t-test, uncorrected for multiple comparisons). j Box plots of gFC and head size (intracranial volume, ICV) by sex, both significantly different by sex by two-sample two-sided t-test (p = 9.1e−9 and <1e−20, respectively). k Color chart of significance of main effects of multiple ANCOVA models. Sex effects become insignificant when both head size and respiratory variables are modeled. Source data are provided as a source data file, though group identity is redacted.

