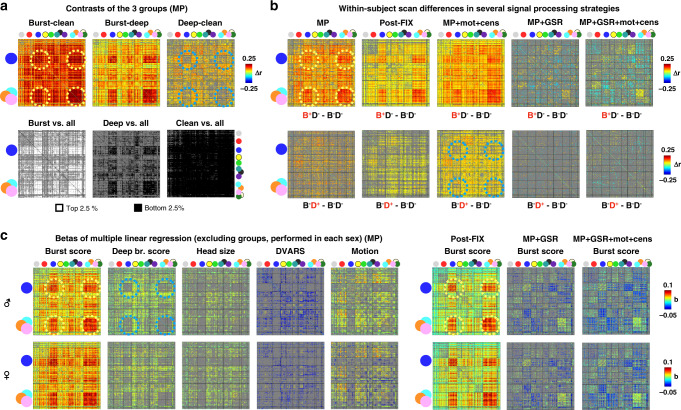
Fig. 6. Functional connectivity associated with breathing patterns.
All images color only contrasts or differences significant at p < 0.05 by 10,000 permutation tests (gray cells are insignificant). a Contrasts of the three groups. The top row shows mean differences between groups. The bottom row shows the rank of mean group correlations amidst random, unrelated groups drawn from the entire cohort. b Mean within-subject differences between scans without breathing patterns (B−D−) and scans with bursts (B+D−, top row) or deep breaths (B−D+, bottom row) (using only scans where both raters fully agreed). c Betas of multiple linear regression performed separately in each sex, using unrelated, non-group-member subjects only. Regressors were z-scored, and all betas are shown for minimally preprocessed (MP) data. Betas for bursts alone are shown for several other data processing strategies (Supplementary Fig. 11 shows full sets of betas). In each of these three main analyses (a, b, c), bursts strongly associated with an increase in sensorimotor correlations (yellow dotted circles), and deep breaths lack elevation in these regions (blue dotted circles).

