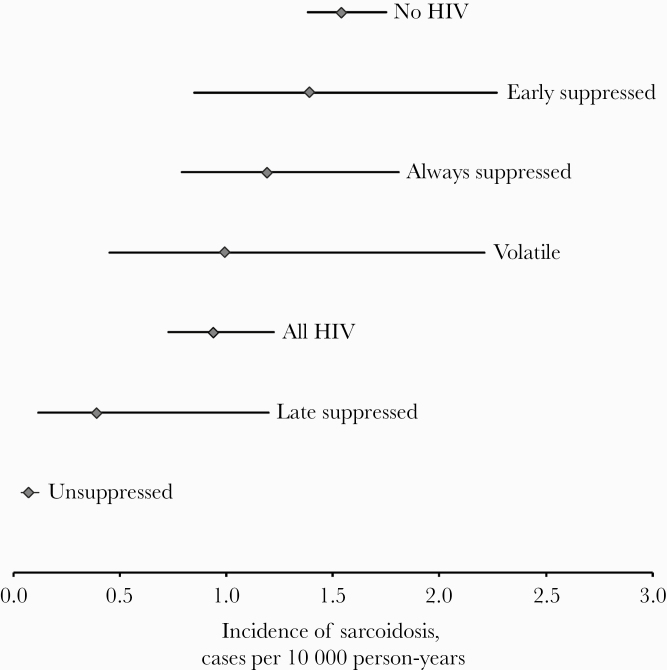
Figure 2.
Incidence of sarcoidosis in groups, defined by presence of HIV and viral load trajectory. Whiskers indicate 95% confidence intervals. Central dots indicate incidence rate. As the confidence intervals are calculated using a Poisson distribution, the size of the confidence intervals tends to increase with an increasing number of observed events.

