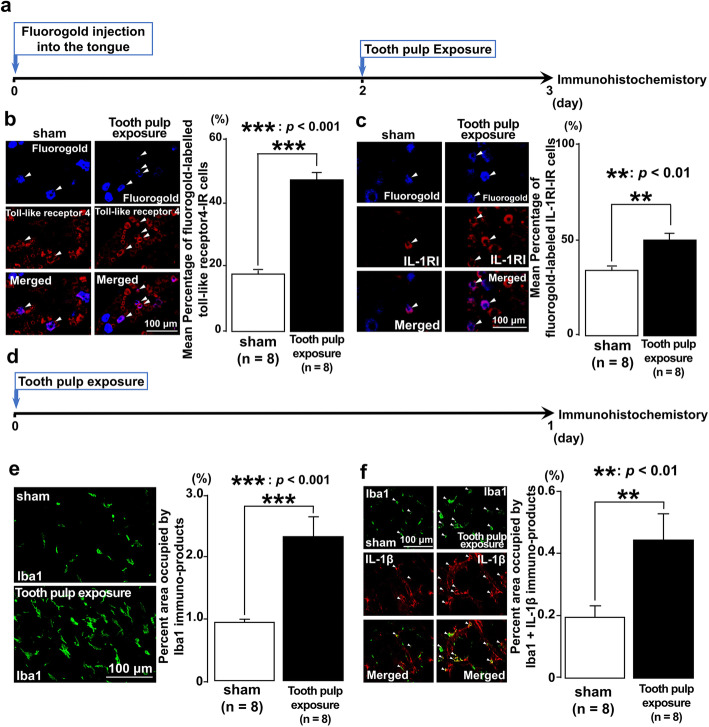
Fig. 2.
Toll-like receptor 4, IL-1RI, Iba1, and IL-1β expression in the trigeminal ganglion following tooth pulp exposure. a Time course of the experimental procedure. b Fluorogold-labeling of toll-like receptor 4-IR cells in the trigeminal ganglion following tooth pulp exposure. The arrowheads indicate fluorogold-labeled toll-like receptor 4-IR cells. Scale bar, 100 μm. The number of each IR cell type in the trigeminal ganglion of the third branch region was calculated by using the following formula: fluorogold-labeled toll-like receptor 4-IR cells/fluorogold-labeled cells × 100%. c Fluorogold-labeled IL-1RI-IR cells in the trigeminal ganglion following tooth pulp exposure. The arrowheads indicate fluorogold-labeled IL-1RI-IR cells. Scale bar, 100 μm. The number of each IR cell type in the trigeminal ganglion of the third branch region was calculated by using the following formula: fluorogold-labeled IL-1RI-IR cells/fluorogold-labeled cells × 100%. d Time course of the experimental procedure. e Iba1-IR cells in the trigeminal ganglion following tooth pulp exposure. Scale bar, 100 μm. The percentage of the area occupied by immuno-products was calculated. f Iba1-IR cells expressing IL-1β in the trigeminal ganglion following tooth pulp exposure. The arrowheads indicate Iba1-IR cells expressing IL-1β. Scale bar, 100 μm. The number of each IR cell type in the trigeminal ganglion of the third branch region was calculated by using the following formula: immuno-products of Iba1 + IL-1β/Iba1 × 100%. The Student’s t test was employed for the comparison of the percentages of positive cells between groups. Data are expressed as the mean ± SEM

