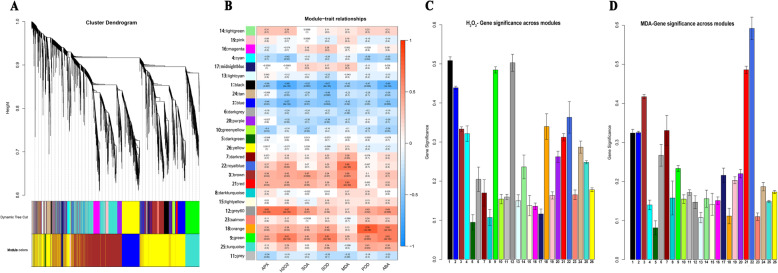
Fig. 5.
WGCNA coexpression network and module-trait correlation analysis. a Hierarchical cluster tree showing coexpression modules identified via the Dynamic Tree Cut method. Different modules are marked with different colors. Each leaf in the tree represents one gene. The major tree branches constitute 26 modules and are labeled with different colors. b Correlations of physiological indicators with WGCNA modules. Each row corresponds to a module and is labeled with the same color as that in a. The columns correspond to physiological indicators. The color of each cell indicates the correlation coefficient between the module and physiological indicator (the top number in the cell represents the correlation coefficient, and bottom one in parentheses represents the P value). c Correlations of H2O2 with WGCNA modules. d Correlations of H2O2 with WGCNA modules. The color bars with the numbers on the X-axis in (c) and (d) designate the modules corresponding to those with numbers and names shown on left side of (b)

