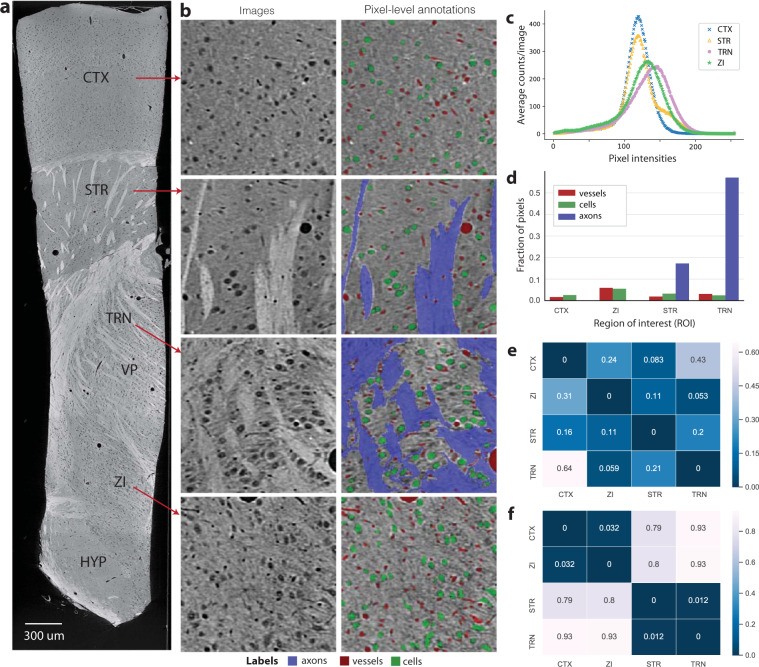
Fig. 2.
Validation of neuroanatomical heterogeneity within the dataset. In (a), an example of a reconstructed image from the dataset following X-ray acquisition, highlighting the regions of interest in the sample. From top to bottom: somatosensory cortex (CTX); striatum (STR); the thalamic reticular nucleus (TRN) and the ventral posterior nucleus (VP) of thalamus; zona incerta (ZI); and hypothalamus (HYP). (b) Examples of the microstructures identified manually within the different ROIS, including cells, axons and blood vessels. These examples each span a roughly 300 × 300 micron field-of-view and highlight the architectural diversity within and across regions of interest. (c) The distribution of pixel intensities across four selected regions of interest within the dataset (CTX, STR, TRN, ZI). (d) The distribution of pixels divided by underlying microstructure class (cell, blood vessel, axon) within each region of interest. In (e,f), we show the KL-divergence between: the pixel intensity distributions across the selected regions (e), and the microstructural composition of selected regions as measured with dense manual annotations (f).

