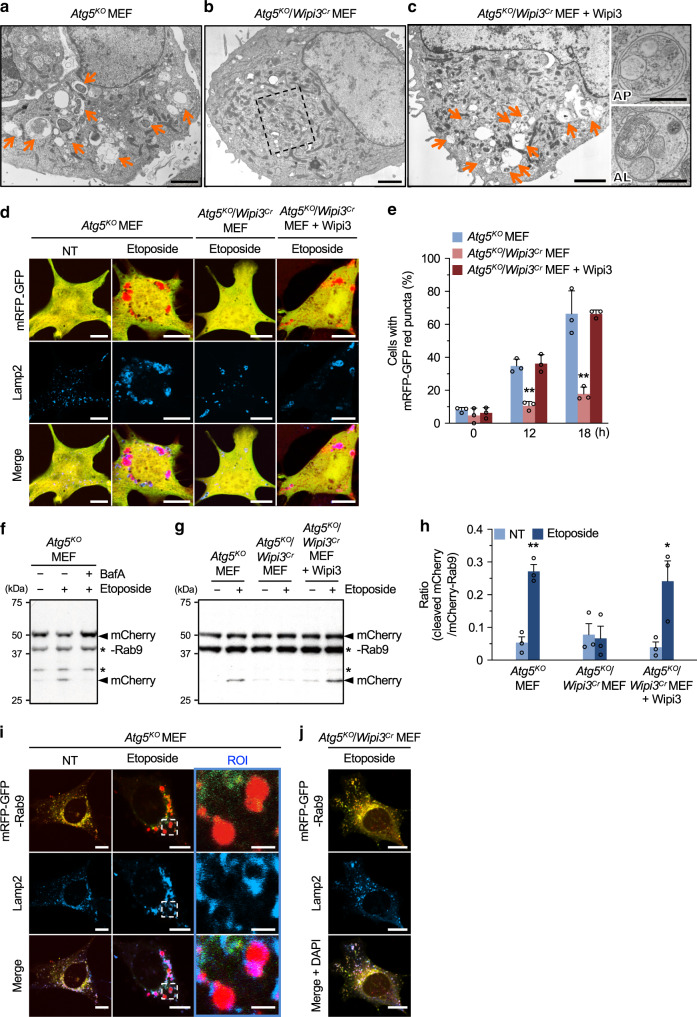
Fig. 2. Wipi3 is essential for etoposide-induced alternative autophagy.
a–c Electron micrographs of the indicated MEFs treated with etoposide (10 µM) for 18 h. Arrows indicate autolysosomes. Bars = 2 µm. A magnified image of the dashed square is shown in Supplementary Fig. 2b. Quick freeze-substitution images of autophagosome (AP) and autolysosome (AL) are shown on the right. Bars = 0.5 µm. d, e The mRFP-GFP tandem protein assay showed the essential role of Wipi3 in alternative autophagy. The indicated MEFs expressing a mRFP-GFP protein were left untreated or were treated with etoposide (10 µM), and were immunostained with an anti-Lamp2 antibody. d Representative images at 18 h are shown. Bars = 10 µm. Red puncta indicate acidic compartments. e The populations of cells with red puncta (>1 µm) are shown (n > 30 cells). Data are shown as the mean ± SD (n = 3 experiments). f–h Degradation of mCherry-fused Rab9 demonstrates the essential role of Wipi3 in alternative autophagy. f, g The indicated MEFs expressing mCherry-Rab9 were treated without or with etoposide (10 µM; 18 h) and bafilomycin A1 (10 nM). The generation of free mCherry, a marker of the autophagic response, was analyzed by immunoblotting. Asterisks indicate nonspecific bands. h Cleavage efficiencies were obtained from western blots. Data are shown as the mean ± SEM (n = 3 experiments). i, j The indicated MEFs transiently expressing the mRFP-GFP-Rab9 protein were left untreated or were treated with etoposide (10 µM; 18 hr), and were immunostained with an anti-Lamp2 antibody. Red signals indicate mRFP-GFP-Rab9 proteins engulfed into acidic compartments. Bars = 10 µm. Magnified images are shown in the right panels. Bars = 2 µm. In (e), **p < 0.01 vs the value of Atg5KO MEFs (12 h: p = 0.0020, 18 h: p < 0.0001). In (h), **p < 0.01 vs the value of untreated Atg5KO MEFs (p = 0.0088) and *p < 0.05 vs the value of untreated Atg5KO/Wipi3Cr + Wipi3 MEFs (p = 0.0243). Comparisons were performed using one-way ANOVA followed by the Tukey post hoc test. Source data are provided as a Source Data file.

