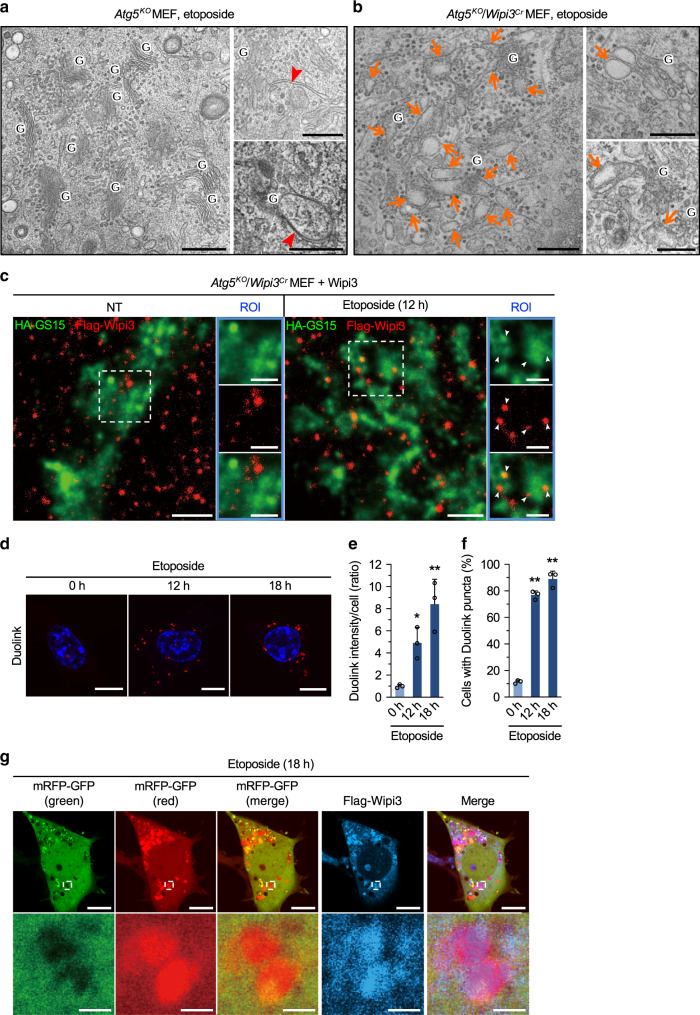
Fig. 3. Effects of Wipi3 on Golgi morphology in etoposide-treated Atg5KO MEFs.
a, b Electron micrographs of the indicated MEFs treated with etoposide (10 µM) for 12 hr. “G” indicates the Golgi apparatus, arrowheads indicate isolation membranes (a), and arrows indicate swollen rod-shaped Golgi membranes (b). Bars = 0.5 µm. c Atg5KO/Wipi3Cr MEFs expressing Flag-Wipi3 and HA-GS15 were left untreated or were treated with etoposide (10 µM) for 12 h. Then, cells were immunostained and observed by STED. Red and green signals indicate Flag-Wipi3 and HA-GS15 (trans-Golgi), respectively. Bars = 1 µm. Magnified images are shown in the right panels. Bars = 0.5 µm. Arrowheads indicate Flag-Wipi3 localized on the trans-Golgi membrane. d–f The close proximity assay performed between Flag-Wipi3 and HA-GS15. Atg5KO/Wipi3Cr MEFs were transiently transfected with Flag-Wipi3 and HA-GS15 for 24 h and treated with etoposide (10 µM). Then, the Wipi3–GS15 interaction was visualized using anti-Flag and anti-HA antibodies with a Duolink detection kit (d). Red signals indicate positive interactions. Bars = 10 µm. In (e), the signal intensities per cell were calculated and data are shown as proportions of the value of untreated cells (mean ± SD). In (f), the populations of MEFs with a positive Duolink signal were calculated. Data are shown as the mean ± SD (n > 50 cells examined over three independent experiments). g Atg5KO/Wipi3Cr MEFs expressing mRFP-GFP and Flag-Wipi3 were treated with etoposide (10 µM) for 18 h. Then, cells were immunostained with an anti-Flag antibody. In the mRFP-GFP merged image, red puncta were well colocalized with Flag-Wipi3. Bars = 10 µm. Magnified images of the dashed squares are shown in the lower panels. Bars = 2 µm. In (e, f), comparisons were performed using one-way ANOVA followed by the Tukey post hoc test. In (e), *p < 0.05 and **p < 0.01 vs the value of 0 h (12 h: p = 0.0473, 18 h: p = 0.0025). In (f), **p < 0.01 vs the value of 0 h (Exact p values cannot be described since the value is too small [p < 0.0001]). Source data are provided as a Source Data file.

