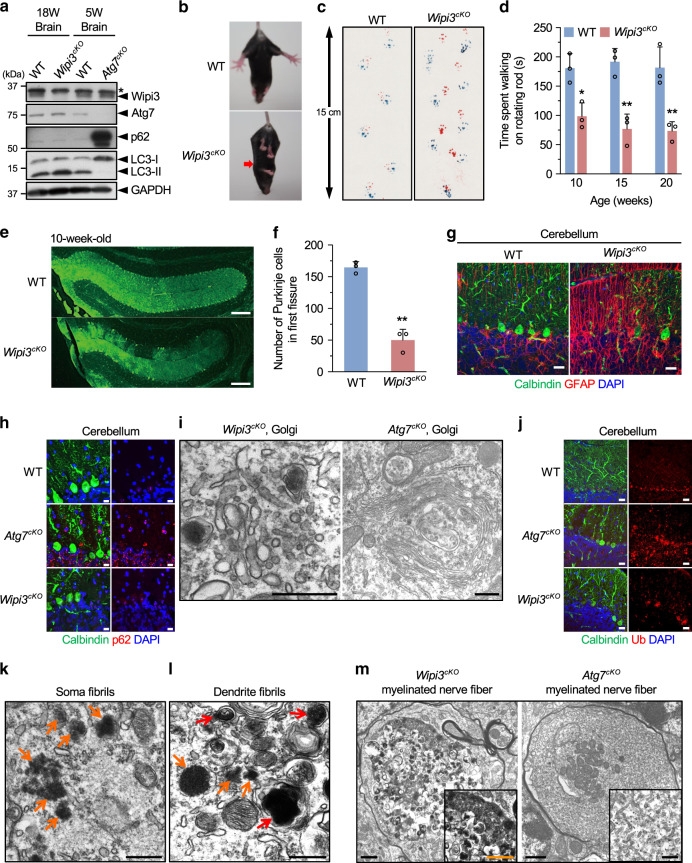
Fig. 7. Neurological defects in neuron-specific Wipi3cKO mice.
a Western blot analysis of brain lysates. The asterisk indicates a nonspecific band. Wipi3cKO mice at 18-weeks were compared with Atg7cKO mice at 5-weeks, as they showed equivalent disease severity. b–d Abnormal motor performance in Wipi3cKO mice at 10-weeks. The limb-clasping reflex was observed (b). The footprint assay indicated a motor deficit (c). In (d), the time the indicated mice remained on the rod was measured. Data are shown as the mean ± SD (n = 3). e–g Cryosections of the indicated cerebellum were immunostained for the Purkinje cell marker calbindin (green), the glial cell marker GFAP (red), and DAPI (blue). Bars = 200 µm (e) and 20 µm (g). In (f), the number of Purkinje cells in the first fissure of the cerebellum is shown. Data are shown as the mean ± SD (n = 3). h–m Comparisons of morphology between WT, Wipi3cKO mice (10-weeks), and Atg7cKO mice (5-weeks). In (h), cryosections of the cerebellum immunostained with anti-calbindin and anti-p62 antibodies. Bar = 10 µm. (i) Morphology of Golgi in cerebella. Small fragmented and swollen rod-shaped Golgi membranes were observed in the Purkinje cells from Wipi3cKO mice. Bars = 0.5 µm. j Immunostaining of calbindin and ubiquitin (Ub) using cryosections of the cerebellum. Bars = 20 µm. k, l The accumulation of fibrils was observed in Purkinje cells from Wipi3cKO mice. Bars = 0.5 µm. Orange and red arrows indicate naked fibrils and fibrils imperfectly enclosed by autophagy-like membranes, respectively. (m) Myelinated nerve fibers of Atg7cKO cerebella and Wipi3cKO cerebella were filled with smooth ER and dense fibrils, respectively; bars = 1 µm (Wipi3cKO) and 0.5 µm (Atg7cKO). Magnified images are shown in the inset; bars = 1 µm (Wipi3cKO) and 0.2 µm (Atg7cKO). In (c), comparisons were performed using one-way ANOVA followed by the Tukey post hoc test. *p < 0.05 and **p < 0.01 (10, 15, 20 weeks: p = 0.0175, 0.0013, 0.0021, respectively.) In (f), comparisons were performed using unpaired two-tailed Student t-tests. **p < 0.01 (p = 0.0005). Source data are provided as a Source Data file.

