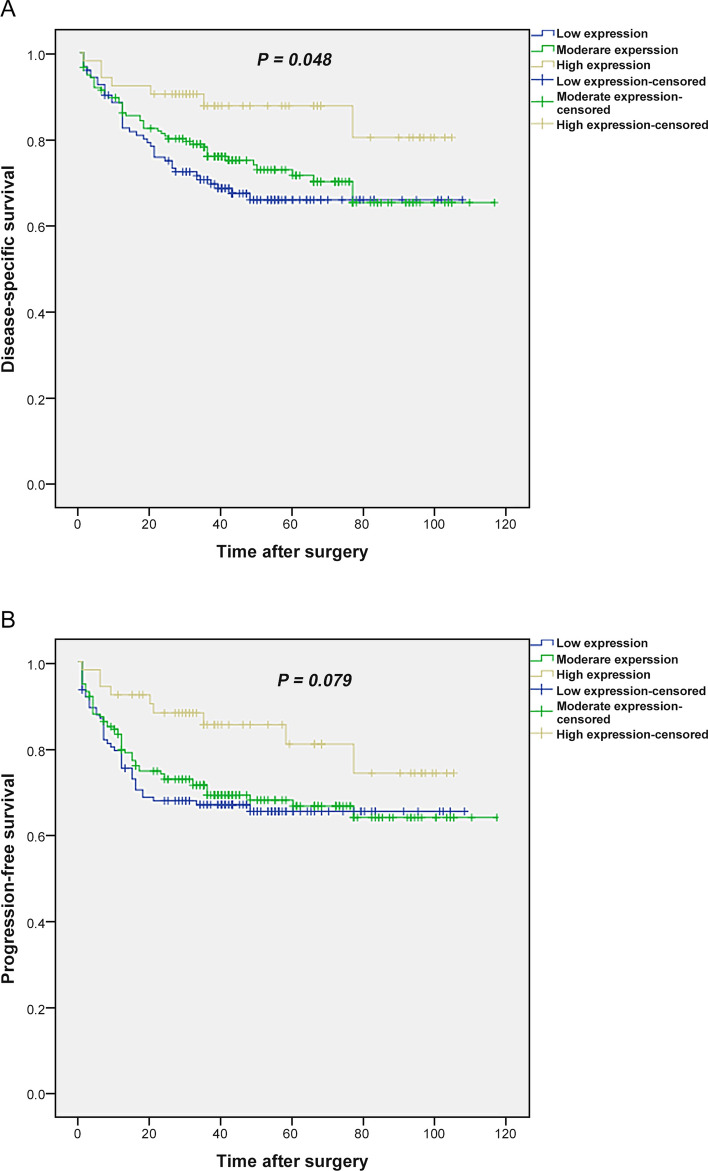
Figure 9.
Kaplan–Meier curves for disease-specific survival (DSS) and progression-free survival (PFS) based on cytoplasmic Talin1 protein expression level in CRC patients. (A) In CRC patients, lower level of Talin1 protein expression was associated with shorter DSS compared to the tumors with high expression of this protein (P = 0.048). (B) Kaplan–Meier survival analysis showed that low levels of Talin1 protein expression are not significantly related to PFS (P = 0.079).

