Figure 6.

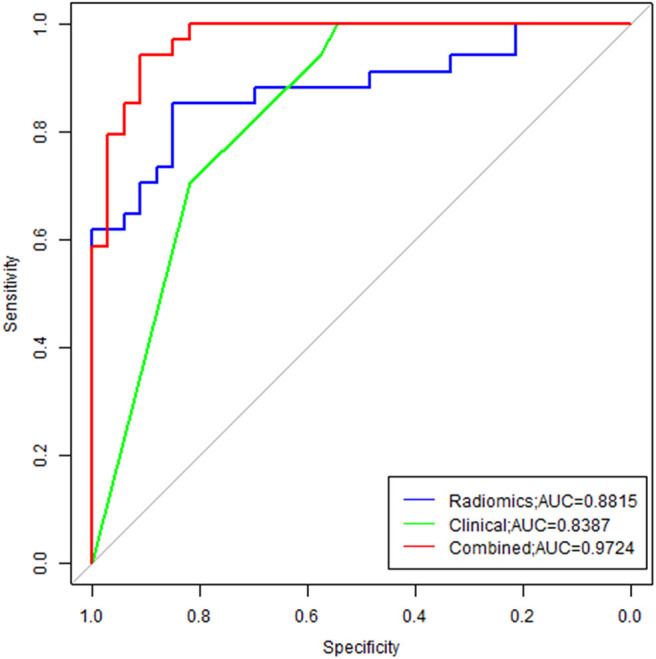
Comparison of ROC between three models. Radiomics model was marked with blue line, and the AUC was 0.8815; Clinical model was marked with green line, and the AUC was 0.8387; The combine model was marked with red line, the AUC was 0.9724.

Comparison of ROC between three models. Radiomics model was marked with blue line, and the AUC was 0.8815; Clinical model was marked with green line, and the AUC was 0.8387; The combine model was marked with red line, the AUC was 0.9724.