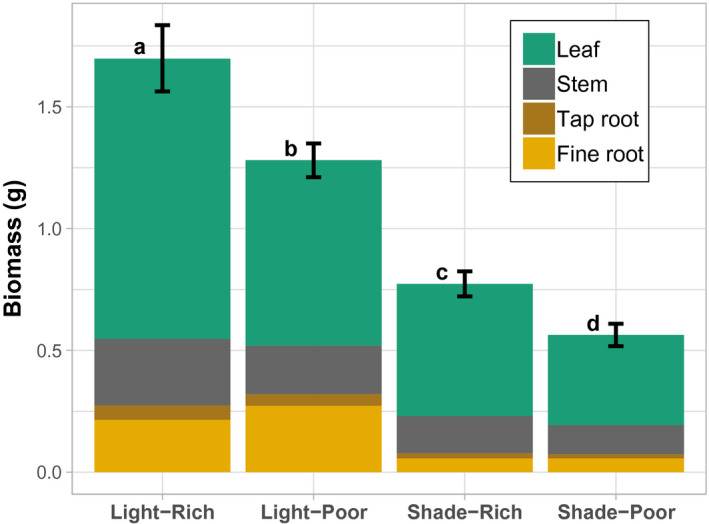
FIGURE 1.

Biomass and mass allocation of leaf, stem, tap root, and fine root tissue across a factorial of light and nutrient limitation. Light/shade, direct sun versus 50% shade. Rich/poor, high nutrients versus 10% nutrient concentration. Whole plant biomass (mean ± SE) of 10 genotypes (estimated marginal mean from the ANOVA, based on 5–6 replicates per genotype) stacked by average tissue contribution. Different lower‐case letters represent significant (p < .05) Tukey's post hoc differences between treatments for whole plant biomass
