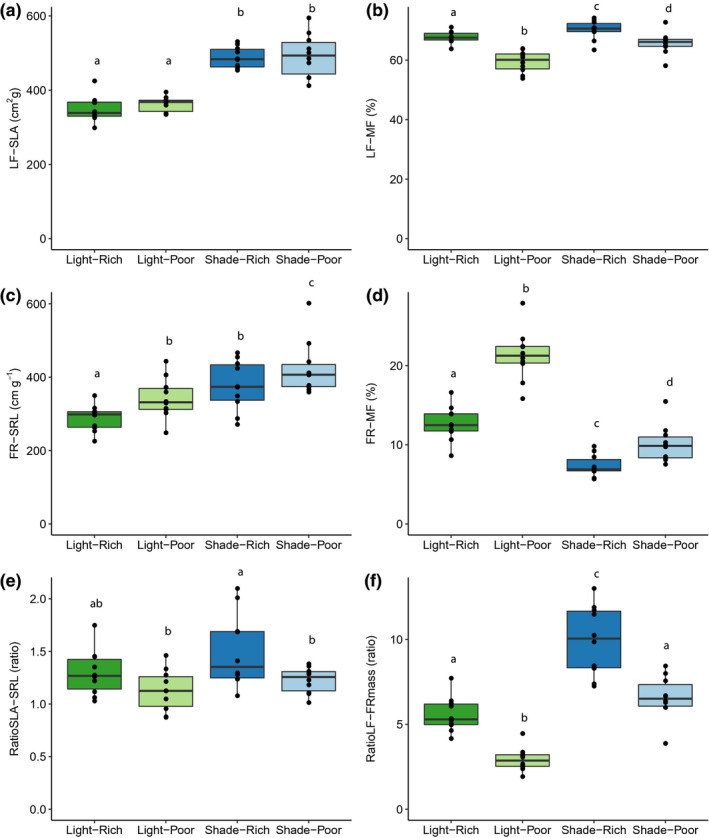
FIGURE 2.

Leaf and fine root morphology across a factorial of light and nutrient limitation. Light/shade, direct sun versus 50% shade. Rich/poor, high nutrients versus 10% nutrient concentration. (a) specific leaf area (LF‐SLA, cm2 g−1), (b) leaf mass fraction (LF‐MF, %), (c) specific root length (FR‐SRL, cm/g), (d) fine root mass fraction (FR‐MF, %), (e) ratio of leaf area to root length (RatioSLA‐SRL), and (f) ratio of leaf mass to fine root mass (RatioLF‐FRmass). Points indicate genotype (n = 10) mean (n = 5–6) at a given treatment. Boxplots show distribution of values. Different letters represent significant (p < .05) Tukey's post hoc differences between treatments for each trait
