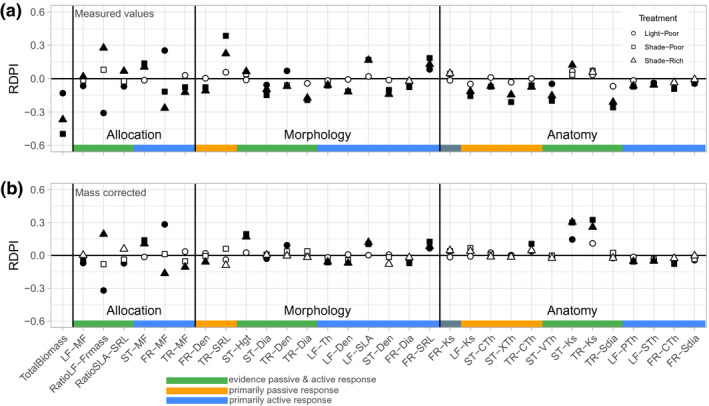
FIGURE 4.

Trait plasticity in response to resource limitation. Points indicate the average (n = 10) relative distance plasticity index (RDPI) in response to light limitation (triangles, Shade‐Rich) or nutrient limitation (circles, Light‐Poor), or combined (squares, Shade‐Poor). Symbol fill represents a t test significance (p < .05) of RDPI being different from zero (filled symbols) or not (open symbols). Traits are ordered based on their treatment response, primarily passive (scaling with mass), primarily active (adjusted independent of mass), or a combination thereof. (a) RDPI values taken from base measurements. (b) RDPI values when correcting trait values for biomass. Trait abbreviations as in Table 1
