Figure 9.

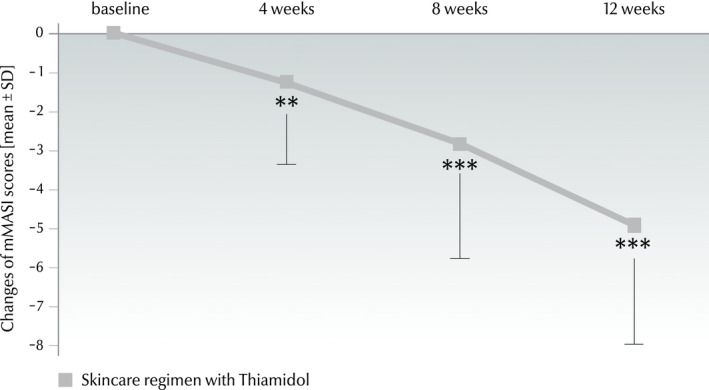
Changes of mMASI scores (mean ± SD) from baseline to week 4 (−1.3 ± 2.0), week 8 (−2.8 ± 2.9) and week 12 (−4.9 ± 3.0) (n = 32) in the real‐world study. Significances are indicated in comparison with baseline (**P ≤ 0.01, ***P ≤ 0.001).

Changes of mMASI scores (mean ± SD) from baseline to week 4 (−1.3 ± 2.0), week 8 (−2.8 ± 2.9) and week 12 (−4.9 ± 3.0) (n = 32) in the real‐world study. Significances are indicated in comparison with baseline (**P ≤ 0.01, ***P ≤ 0.001).