Figure 2.
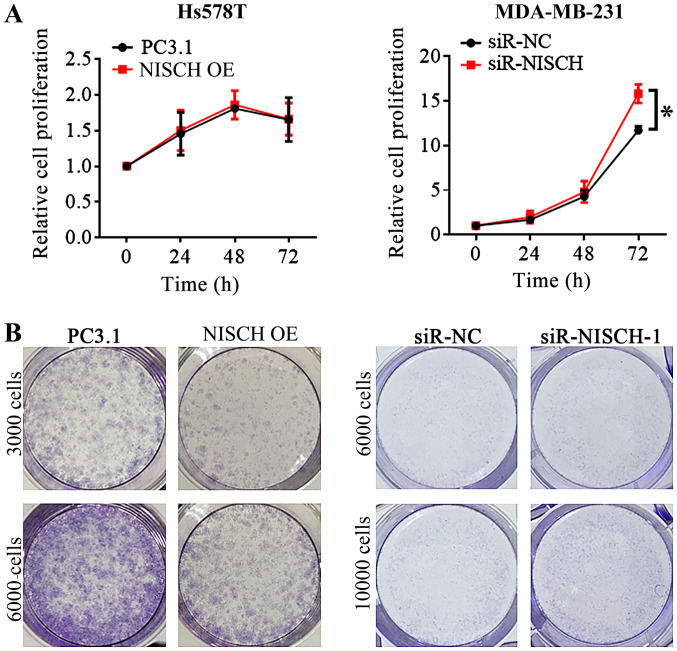
MTT experiment and colony formation assay for Hs578T cells with NISCH overexpressed and MDA-MB-231 cells with knocked down NISCH. (A) In MTT experiments, cells were seeded into a 96-well plate, each well contains 1×10³−1×10⁴ cells. The relative cell proliferation was not significantly different between the Hs578T overexpressing NISCH and control cells, but it is increased in NISCH knockdown MDA-MB-231 cells than that in control cells at 72 h. (B) In the colony formation assay, cells were seeded into 6-well plates at a density of 3000–10,000 cells/well, followed by culture for 2 weeks. The ability of colony formation decreased in NISCH overexpressed Hs578T cells and increased in NISCH knockdown MDA-MB-231 cells. *P<0.05 vs. siR-NC. NISCH, Nischarin; siR, small interfering RNA; PC3.1, pcDNA3.1 empty vector; NC, negative control; OE, overexpression.

