
Figure 1. Patients with SLE Prone to Infections Display an Increased Percentage of CD8CD38high.
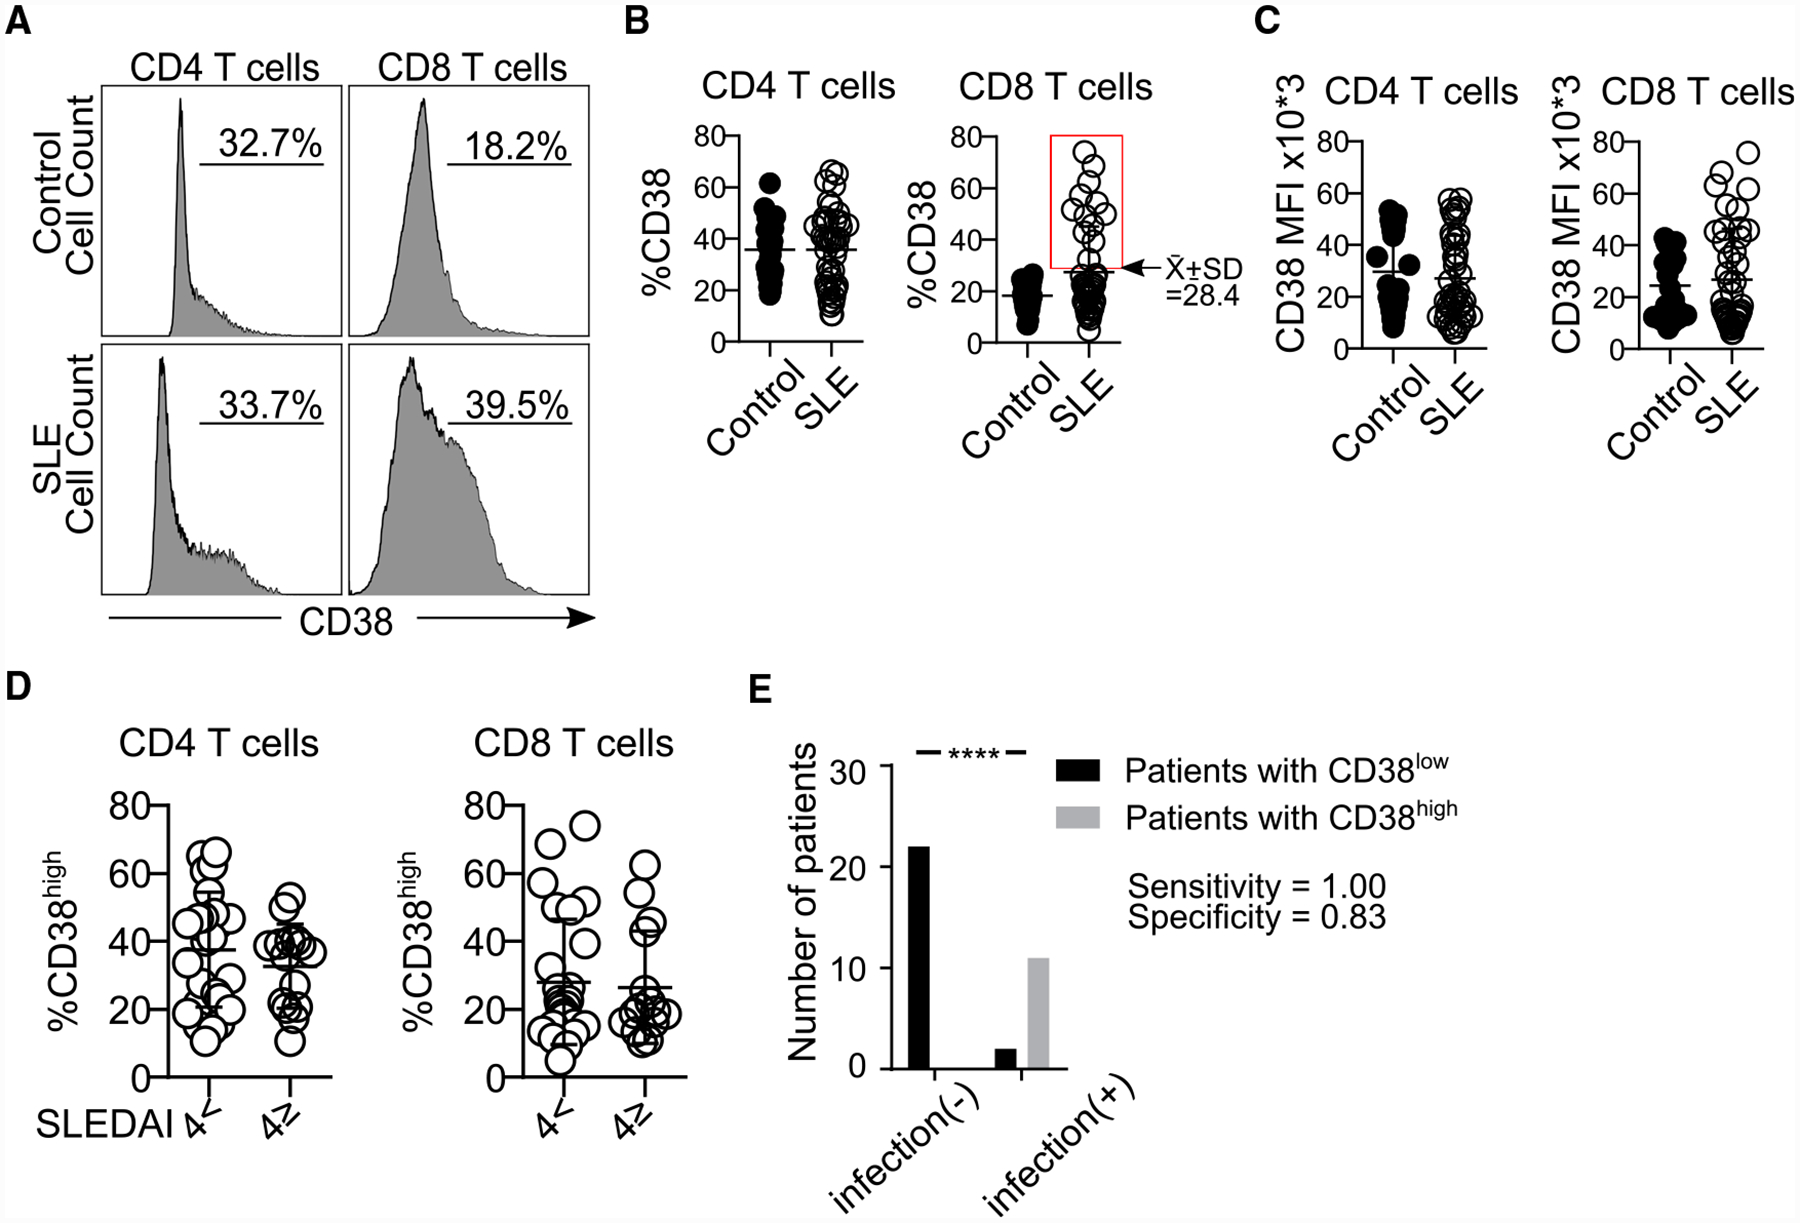
(A) Representative histograms showing CD38 expression in CD4 and CD8 T cells from both a healthy subject and a patient with SLE.
(B) Percentage of CD38 in CD4 and CD8 T cells by flow cytometry. The rectangle identifies the cutoff point separating patients with SLE in 2 subpopulations: those with high or normal percentages of CD8CD38high (healthy subjects = 24, SLE = 42; Welch’s test).
(C) MFI of CD38 in CD4 and CD8CD38high T cells (healthy subjects = 24, SLE = 35: Kolmogorov-Smirnov) from healthy subjects and patients with SLE by flow cytometry.
(D) Percentage of CD4CD38high and CD8CD38high T cells from patients with SLE sorted based on disease activity: inactive (SLEDAI < 4, n = 26) or active (SLEDAI ≥4, n = 15) by flow cytometry (Kolmogorov-Smirnov test).
(E) Sensitivity and specificity of the percentage of CD8CD38high T cells in defining patients with any infection (SLE = 35, chi-square test).
In all figures, average data are represented as mean ± SD.