
Figure 2. CD8CD38high T Cells Display Poor Cytotoxic Capacity.
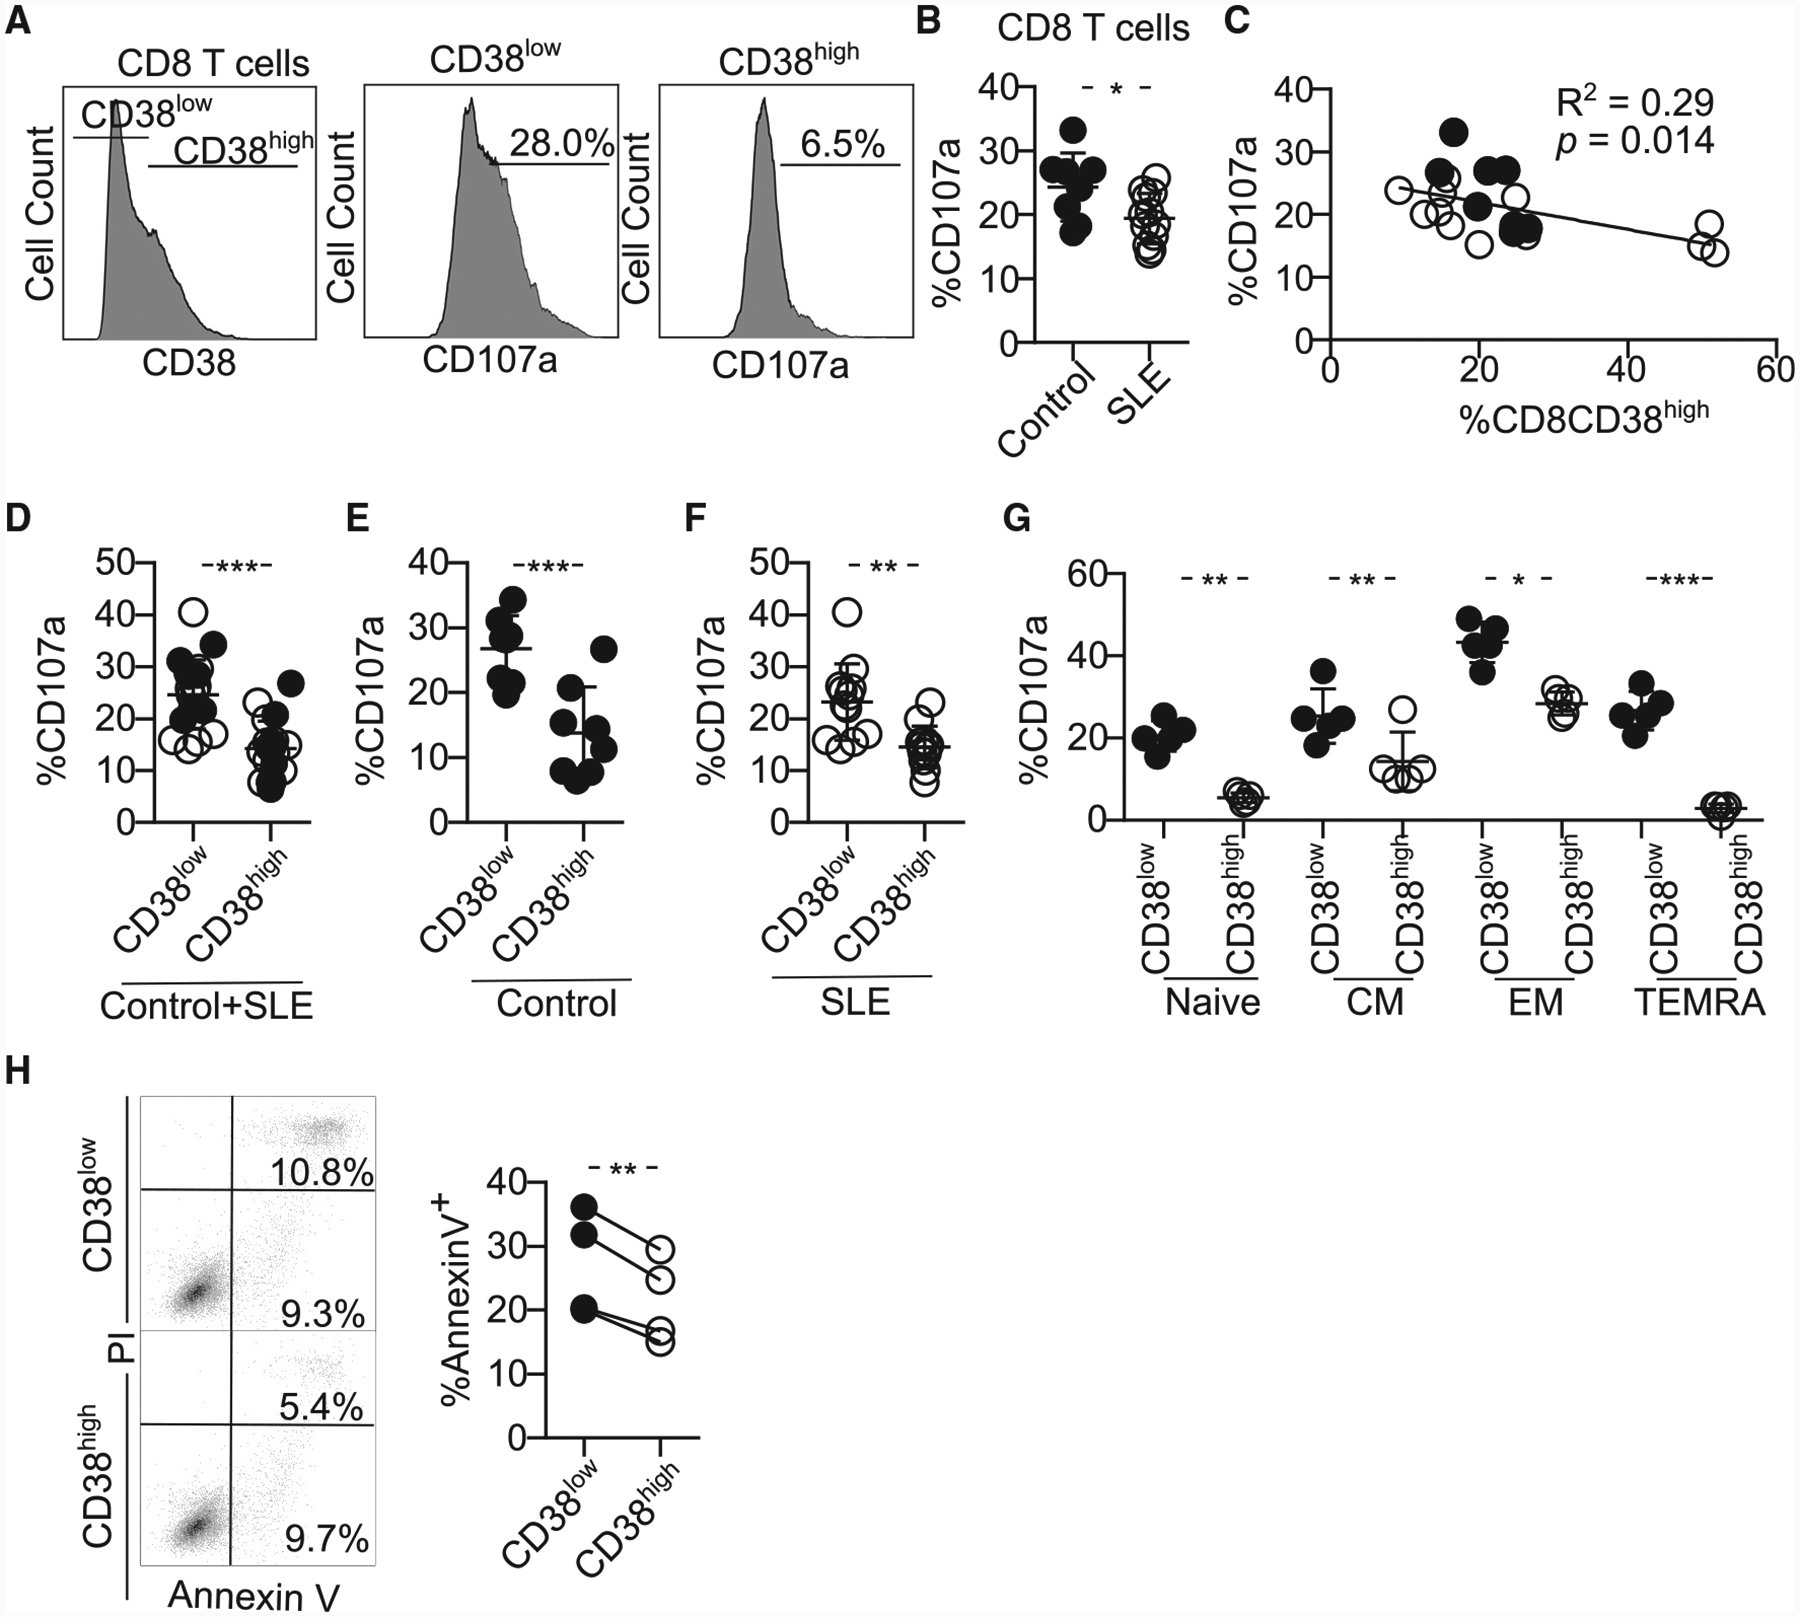
(A) Representative histograms showing the expression of CD107a on CD8CD38low and CD8CD38high T cells from healthy subjects by flow cytometry. To measure CD107a expression, cells were stimulated with plate-coated CD3 and CD28 antibodies with Golgiplug and anti-CD107a for 5 h and stained with proper surface markers.
(B) Degranulation (%CD107a) of CD8 T cells from healthy subjects and patients with SLE evaluated by flow cytometry (healthy subjects = 8, SLE = 12; Welch’s test).
(C) Correlation between percentage of CD38high and degranulation in CD8 T cells (healthy subjects = 8, SLE = 12; closed circles, healthy subjects; opened circles, SLE; Pearson’s correlation).
(D–F) Degranulation (%CD107a) of CD8 T cells sorted on CD38low and CD38high of both healthy subjects and patients with SLE in both groups (D) and separately in healthy subjects (E) and SLE (F) by flow cytometry (healthy subjects = 8, SLE = 12; closed circles, control; opened circles, SLE; healthy subjects = 8, SLE = 12; Welch’s test).
(G) Degranulation (%CD107a) of the different subpopulations of CD8 T cells sorted on CD38low and CD38high by flow cytometry (n = 5 healthy donors; one-way ANOVA with multiple comparison).
(H) Representative dot blots (left) and cumulative data (right) showing percentage of of Annexin V+ P815 cells after coincubation with CD8CD38low or CD8CD38high T cells from healthy subjects analyzed by flow cytometry (normal T cells = 4; Kolmogorov-Smirnov test).
In all figures, average data are represented as mean ± SD.