
Figure 3. CD8CD38high T Cells Express Low Levels of Cytotoxic Molecules.
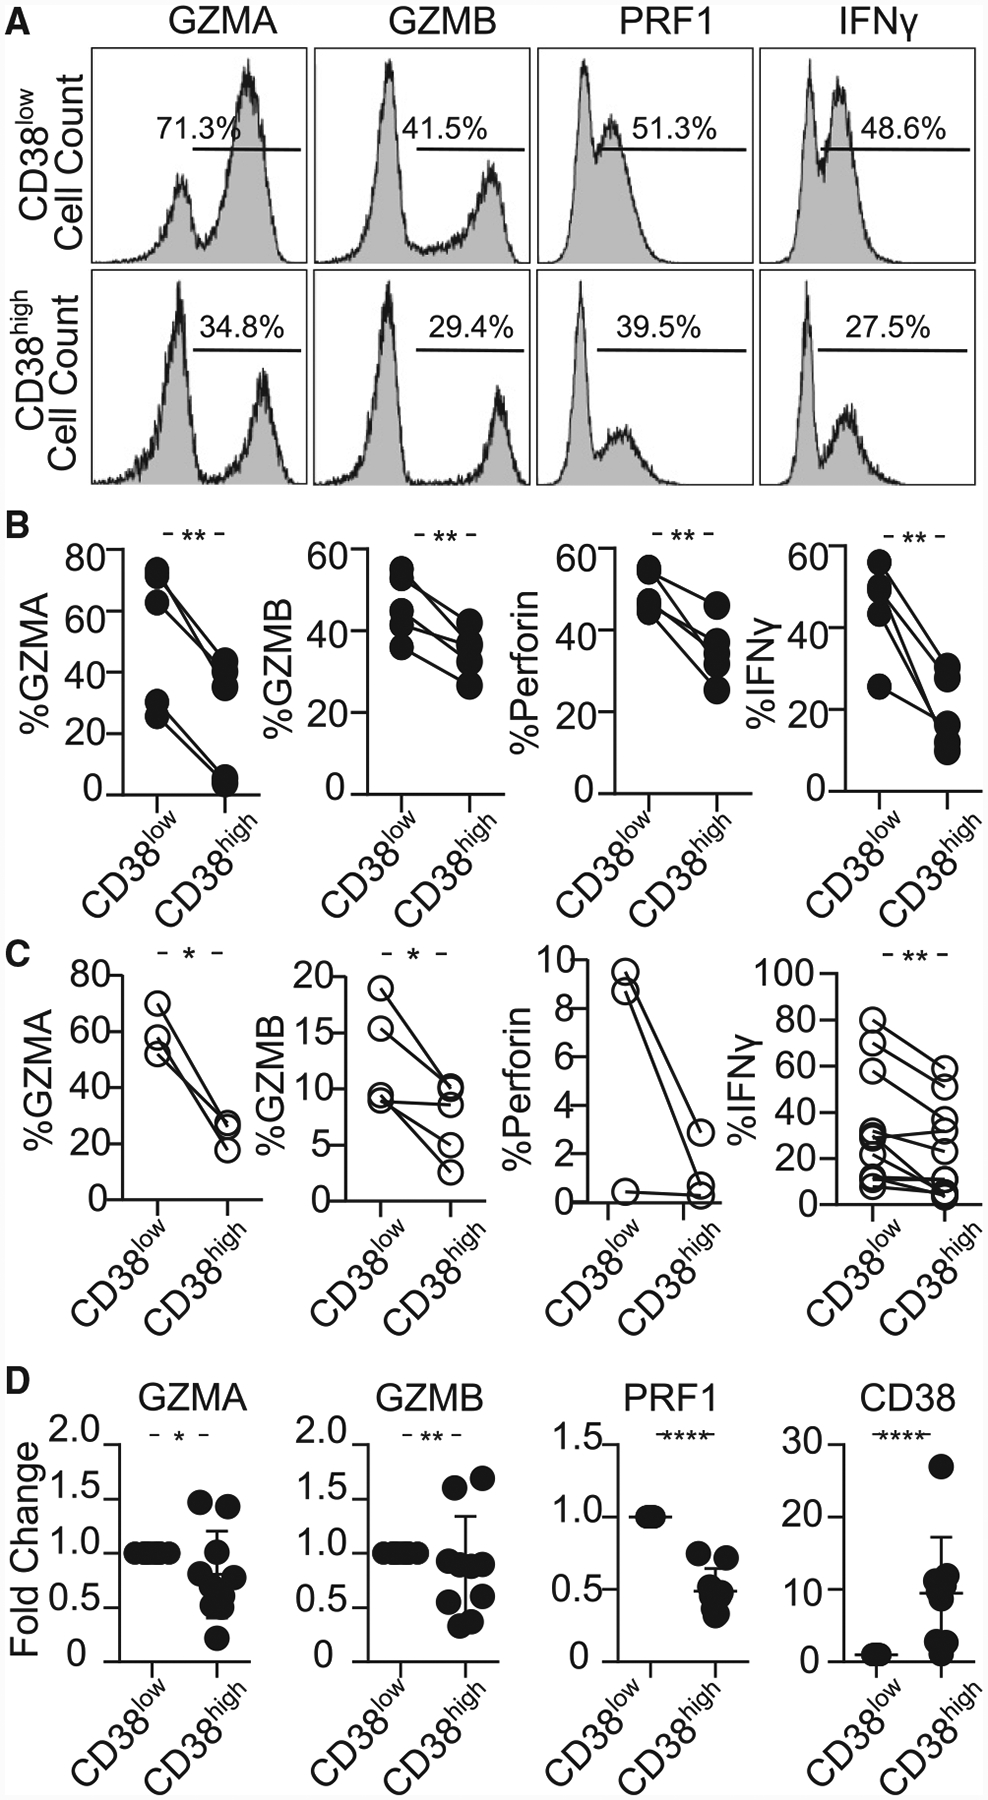
(A) Representative histograms showing granzyme A (GZMA), granzyme B (GZMB), perforin (PRF1), and interferon gamma (IFN-γ) in CD8CD38low and CD38high T cells from a healthy subjects by flow cytometry.
(B) Percentage of GZMA, GZMB, perforin and IFN-γ in CD8CD38low and CD8CD38high T cells evaluated by flow cytometry (healthy subjects ≥3; paired t test).
(C) Percentage of GZMA, GZMB, perforin, and IFN-γ in CD8CD38low and CD8CD38high T cells evaluated by flow cytometry (SLE ≥3; paired t test).
(D) mRNA levels of GZMA, GZMB, PRF1, and CD38 from CD8CD38low and CD8CD38high T cells by quantitative PCR (normal T cells = 10; Kolmogorov-Smirnov test). Cells were sorted by fluorescence-activated cell sorting (FACS) aria.
In all figures, average data are represented as mean ± SD.