
Figure 4. CD8CD38high T Cells Express Decreased Levels of EOMES, RUNX3, and T-bet.
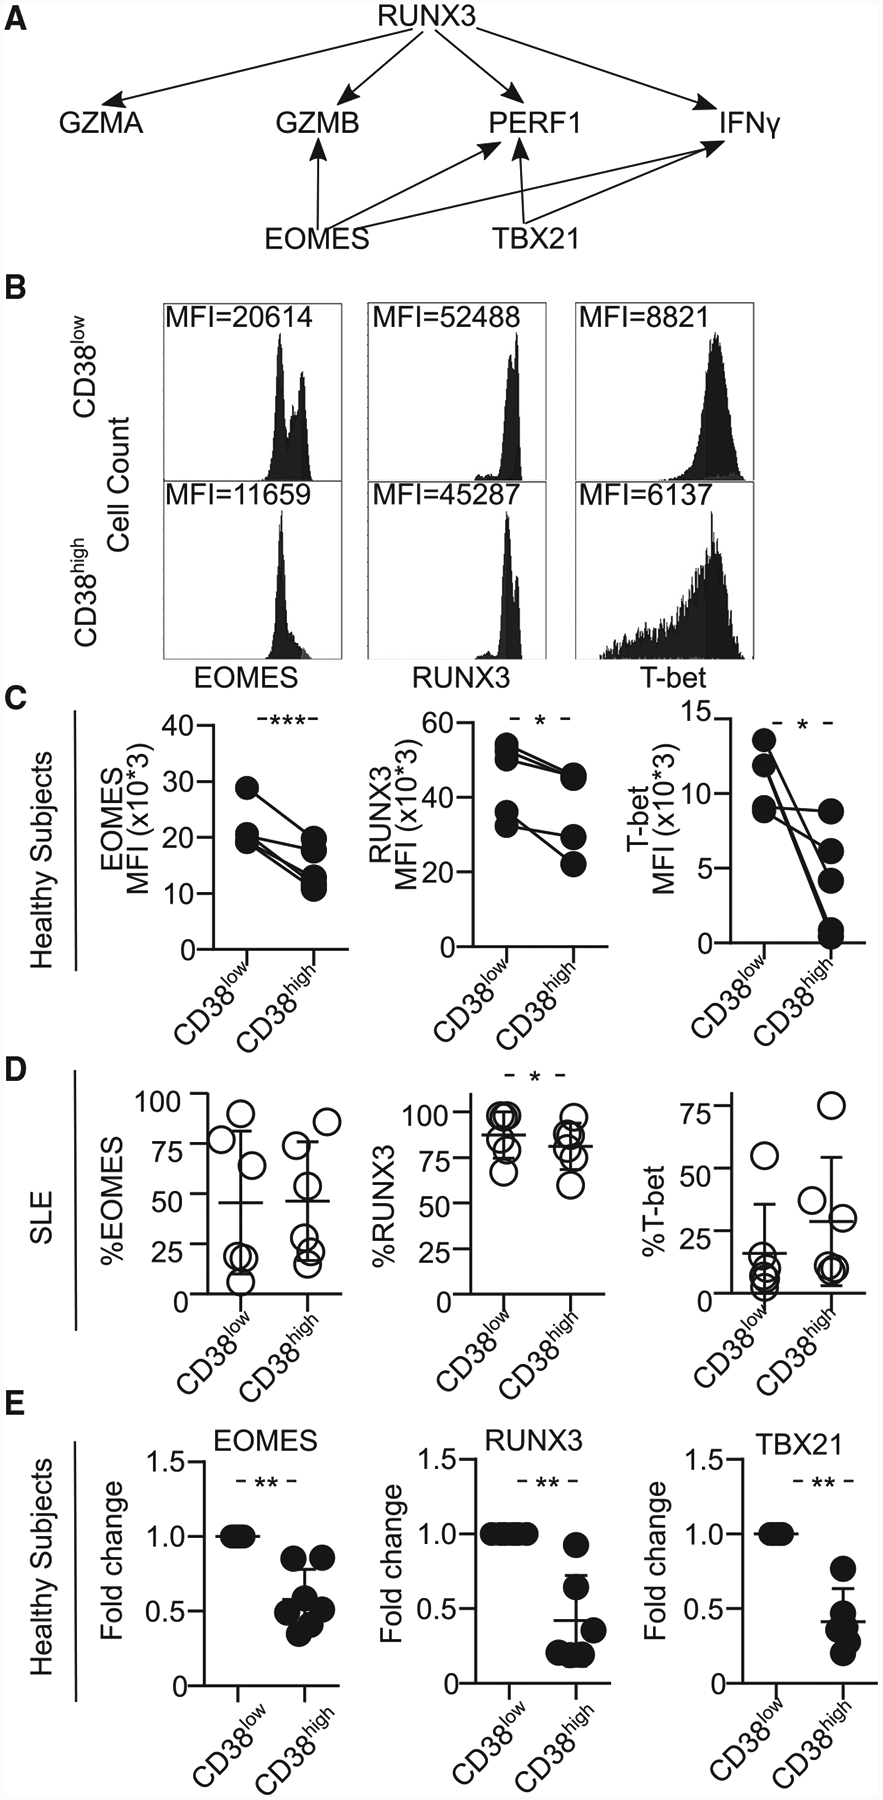
(A) Scheme showing the transcription factors regulating various cytotoxic molecules.
(B) Representative histograms showing EOMES, RUNX3, and T-bet in CD8CD38low and CD38high T cells from a healthy donor by flow cytometry.
(C) MFI from EOMES, RUNX3, and T-bet in CD8CD38low and CD8CD38high T cells from by flow cytometry (healthy subjects ≥3; paired t test).
(D) Percentage of EOMES, RUNX3, and T-bet in CD8CD38low and CD8CD38high T cells by flow cytometry (SLE = 6; paired t test).
(E) mRNA levels of EOMES, RUNX3, and T-bet (TBX21) in CD8CD38low and CD8CD38high T cells by flow cytometry (normal T cells = 10; Kolmogorov-Smirnov test). Cells were sorted by FACS aria.
In all figures, average data are represented as mean ± SD.