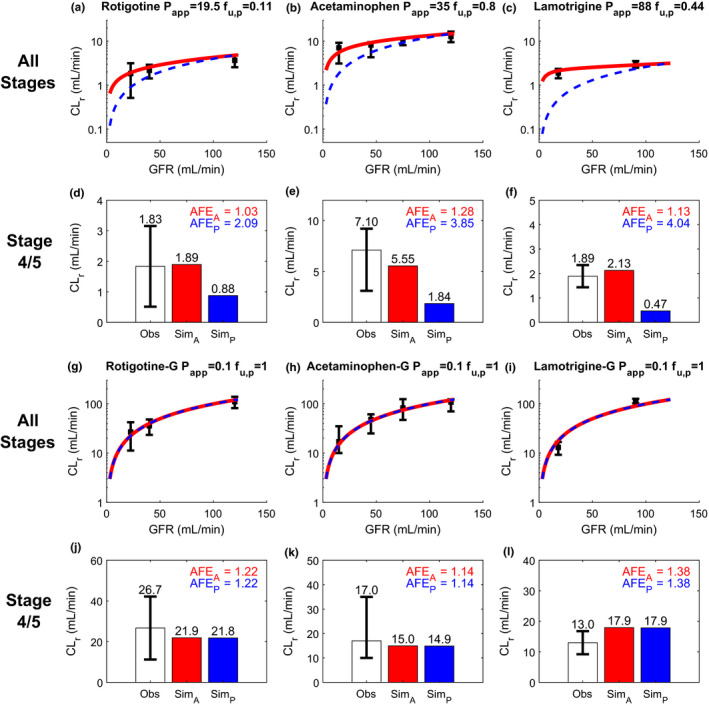
Figure 3.

Simulation (Sim) and verification of renal clearance (CLr) of three drugs and their corresponding glucuronide metabolites at multiple stages of chronic kidney disease (CKD) reflected by varying glomerular filtration rate (GFR). Observed (Obs) CLr data are shown as black solid squares depicting the group mean value with error bar showing the 95% confidence interval. The simulated CLr of different test compounds at varying stages of CKD are shown with red curves for the adaptive model and blue dashed curves for the proportional model (a–c, g–i). The performance of the adaptive and proportional models was evaluated at CKD stages 4 and 5 where GFR ≤ 30 mL/min using calculated absolute fold‐error (AFE)A (shown in red) and AFEP (shown in blue), respectively (d–f, j–l). The experimentally determined apparent permeability (P app), plasma unbound fraction (f u,p), and observed CLr data of rotigotine a, d, acetaminophen b, e, and lamotrigine c, f were collected from literature and summarized in Table S2 . The P app and f u,p values of all glucuronide metabolites g–l were assumed to be 0.1 × 10‐6 cm/s and 1, respectively, based on their physicochemical properties. The observed CLr data of all metabolites were from the same subjects in the same studies of their respective parent drugs (Table S2 ). The simulation results are shown on linear scale in Figure S1 .
