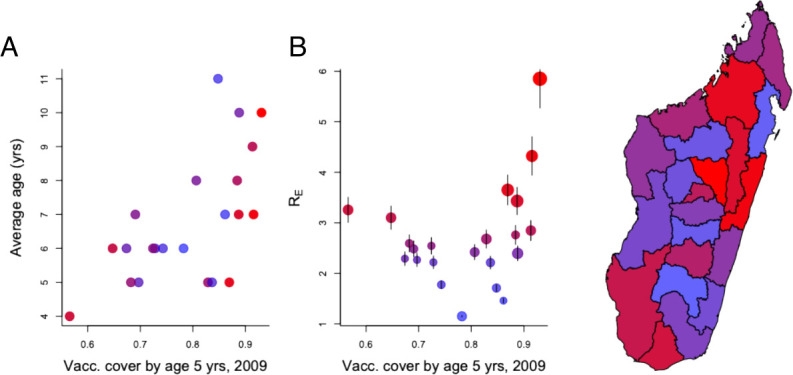
Figure 2.

Outbreak characteristics. (A) Measles vaccination coverage at 5 years in each of the 22 regions estimated from Madagascar’s 2009 Demographic and Health Survey (x-axis) plotted against (A) the median age distribution of cases (y-axis) and (B) the RE of the outbreak in each region (y-axis). On both plots, regions with higher rE are shaded from blue to red; and these are also shown in the MAP, to indicate fastest early growth of the outbreak in central/norther regions. Two regions (Androy and Atsimo Andrefana) have high rE despite low vaccination coverage (red points to the left of B). Regional connectivity might be sufficiently low in these remote locations that even at low vaccination coverage, local extinction occurs, allowing susceptible build-up, or vaccination coverage in 2009 might provide a poor proxy for changes over the intervening decade.
