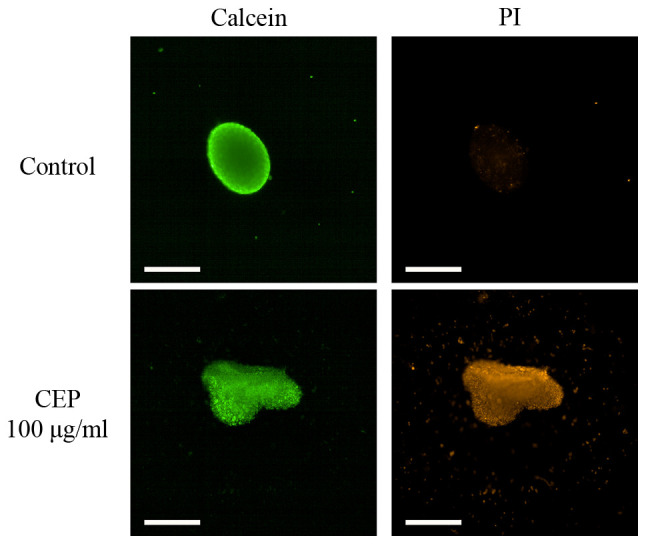
Figure 10.

Photomicrographs of CEP-treated 3D MCF-7 spheroids stained with calcein or PI. MCF-7 spheroids were treated with 100 µg/ml CEP and stained with calcein green or PI red, representing the cytoplasm or dead cells, respectively. Scale bar, 500 µm. CEP, cepharanthine; PI, propidium iodide.
