Figure 12.
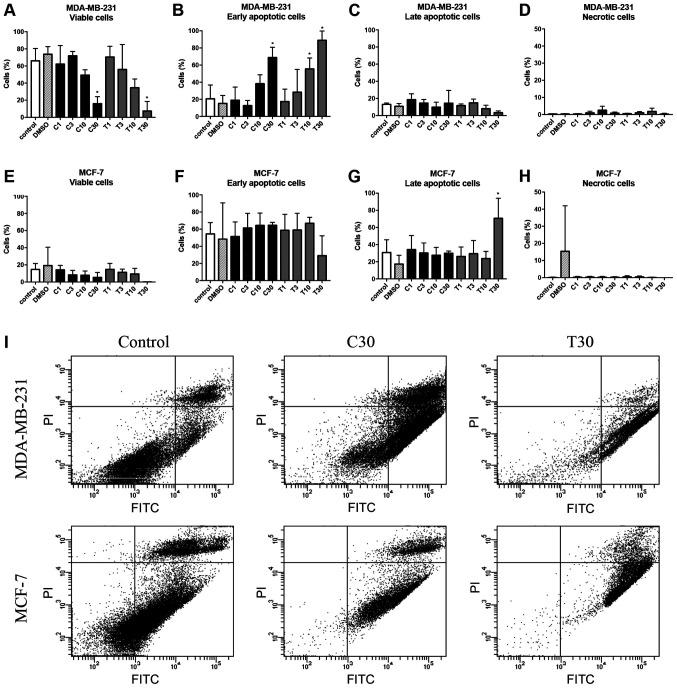
Effects of CEP and TET on percentages of viable, early apoptotic, late apoptotic and necrotic cells of MDA-MB-231 and MCF-7 spheroids. After the treatment with different concentrations of CEP or TET, 3D MDA-MB-231 spheroids were stained with Annexin V-FITC and PI to identify (A) viable, (B) early apoptotic, (C) late apoptotic and (D) necrotic cells. Similarly, MCF-7 spheroids were stained with Annexin V-FITC and PI to identify (E) viable, (F) early apoptotic, (G) late apoptotic and (H) necrotic cells. The data are shown as the mean + SD of 4 independent experiments. (I) Cells treated with 30 µg/ml CEP or TET were classified into four groups based on different quadrants: Viable cells (bottom left), early apoptotic cells (bottom right), late apoptotic cells (upper right) and necrotic cells (upper left) using flow cytometry. *P<0.05 vs. control analyzed via one-way ANOVA and Dunnett's multiple comparisons test. C/CEP, cepharanthine; T/TET, tetrandrine; PI, propidium iodide.

