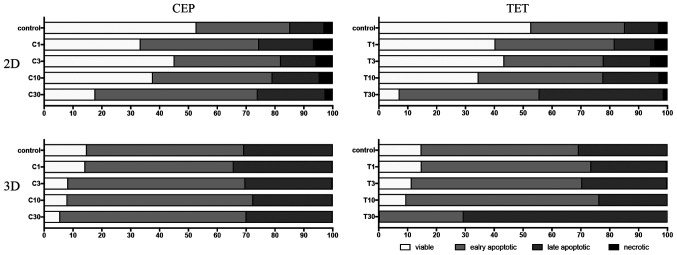
Figure 14.
Comparison of the percentages of viable, early apoptotic, late apoptotic and necrotic cells in 2D monolayer or 3D spheroids MCF-7 cells treated with different concentrations of CEP or TET. 2D- or 3D-cultured MCF-7 cells treated with CEP or TET were categorized into viable (white), early apoptotic (light grey), late apoptotic (dark grey) and necrotic (black) cells after staining with Annexin V and PI analyzed via flow cytometry. C/CEP, cepharanthine; T/TET, tetrandrine.

