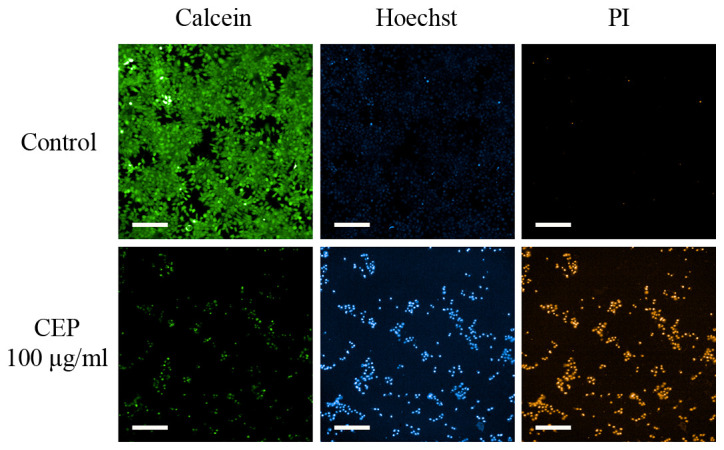
Figure 7.

Photomicrographs of CEP-treated 2D MCF-7 monolayer cells stained with calcein, Hoechst or PI. MCF-7 cells were treated with 100 µg/ml CEP and stained with calcein green, Hoechst blue or PI red, which represent the cytoplasm, chromatin (nuclei) or dead cells, respectively. CEP induced chromatin aggregation and cell death. Scale bar, 200 µm. CEP, cepharanthine; PI, propidium iodide.
