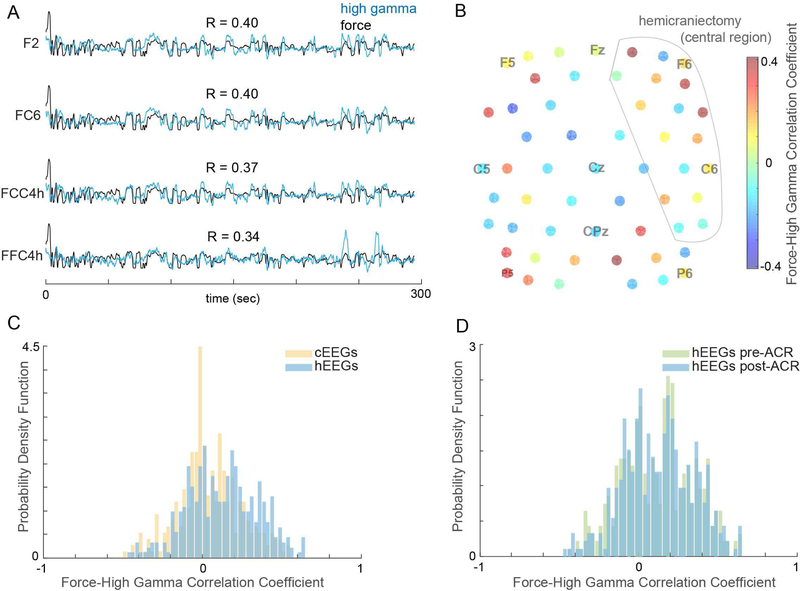
Fig. 2. Characteristics of hEEG.
(A) High gamma signal (blue) recorded from four hEEG electrodes overlaid on finger flexion force (black) in one run. (B) Correlations between HG and force from electrodes in the central region from same run. (C) Distributions of force-HG correlations for hEEG and cEEG after ACR. (D) Distributions of force-HG correlations for hEEG before and after ACR

