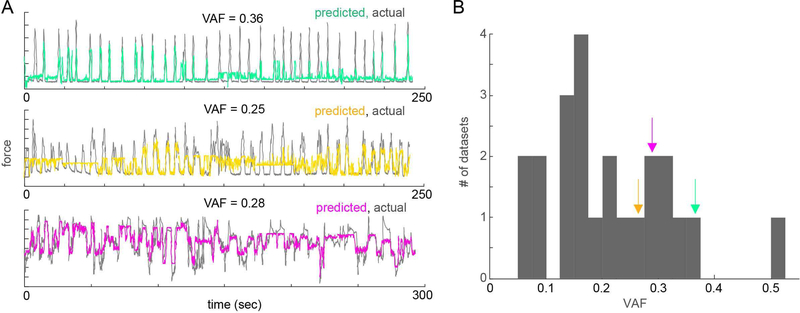
Fig. 3. Decoding flexion force from hEEG.
(A) Overlaid traces of predicted (color) vs actual (gray) finger flexion force in three datasets from three subjects. VAF for each run labeled above each trace. (B) Distribution of decoding performance (VAF) across all datasets from all subjects (arrows indicate where decoding examples from A fall within distribution).

