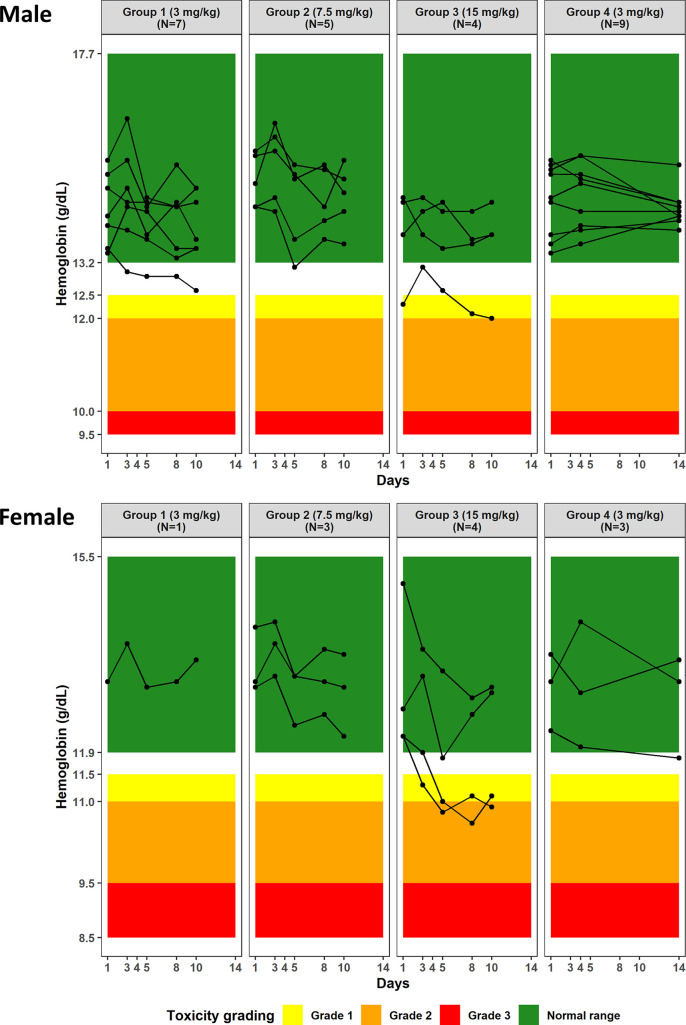
FIG 4.
Time courses of hemoglobin concentrations in male subjects (top panels) and female subjects (bottom panels) in the multiple ascending dose study (group 1, 7 males/1 female; group 2, 5 males/3 females; group 3, 4 males/4 females) and the food effect study (group 4, 9 males/3 females). The green rectangles represent the normal range of hemoglobin concentrations for each gender. The yellow, orange, and red rectangles represent grade 1 (mild), grade 2 (moderate), and grade 3 (severe) toxicity levels, respectively.

